import pandas as pd
import io
import numpy as np
import plotly.graph_objects as go
import plotly.io as pio
import textwrap
# Modern Premium Styling
COLOR_PRODUCE = "#8B5CF6" # Violet 500
COLOR_WHOLESALE = "#64748B" # Slate 500
COLOR_MARGIN_POS = "#0EA5E9" # Sky 500
COLOR_MARGIN_NEG = "#F43F5E" # Rose 500
COLOR_RETAIL = "#10B981" # Emerald 500
COLOR_TAX = "#F59E0B" # Amber 500
COLOR_DISTRIBUTOR_MARGIN = "#06B6D4" # Cyan 500
BG_COLOR = "#F8FAFC" # Slate 50
TEXT_MAIN = "#0F172A" # Slate 900
TEXT_MUTED = "#64748B" # Slate 500
FIXED_HEIGHT = 1200
MAX_ITEMS = 7
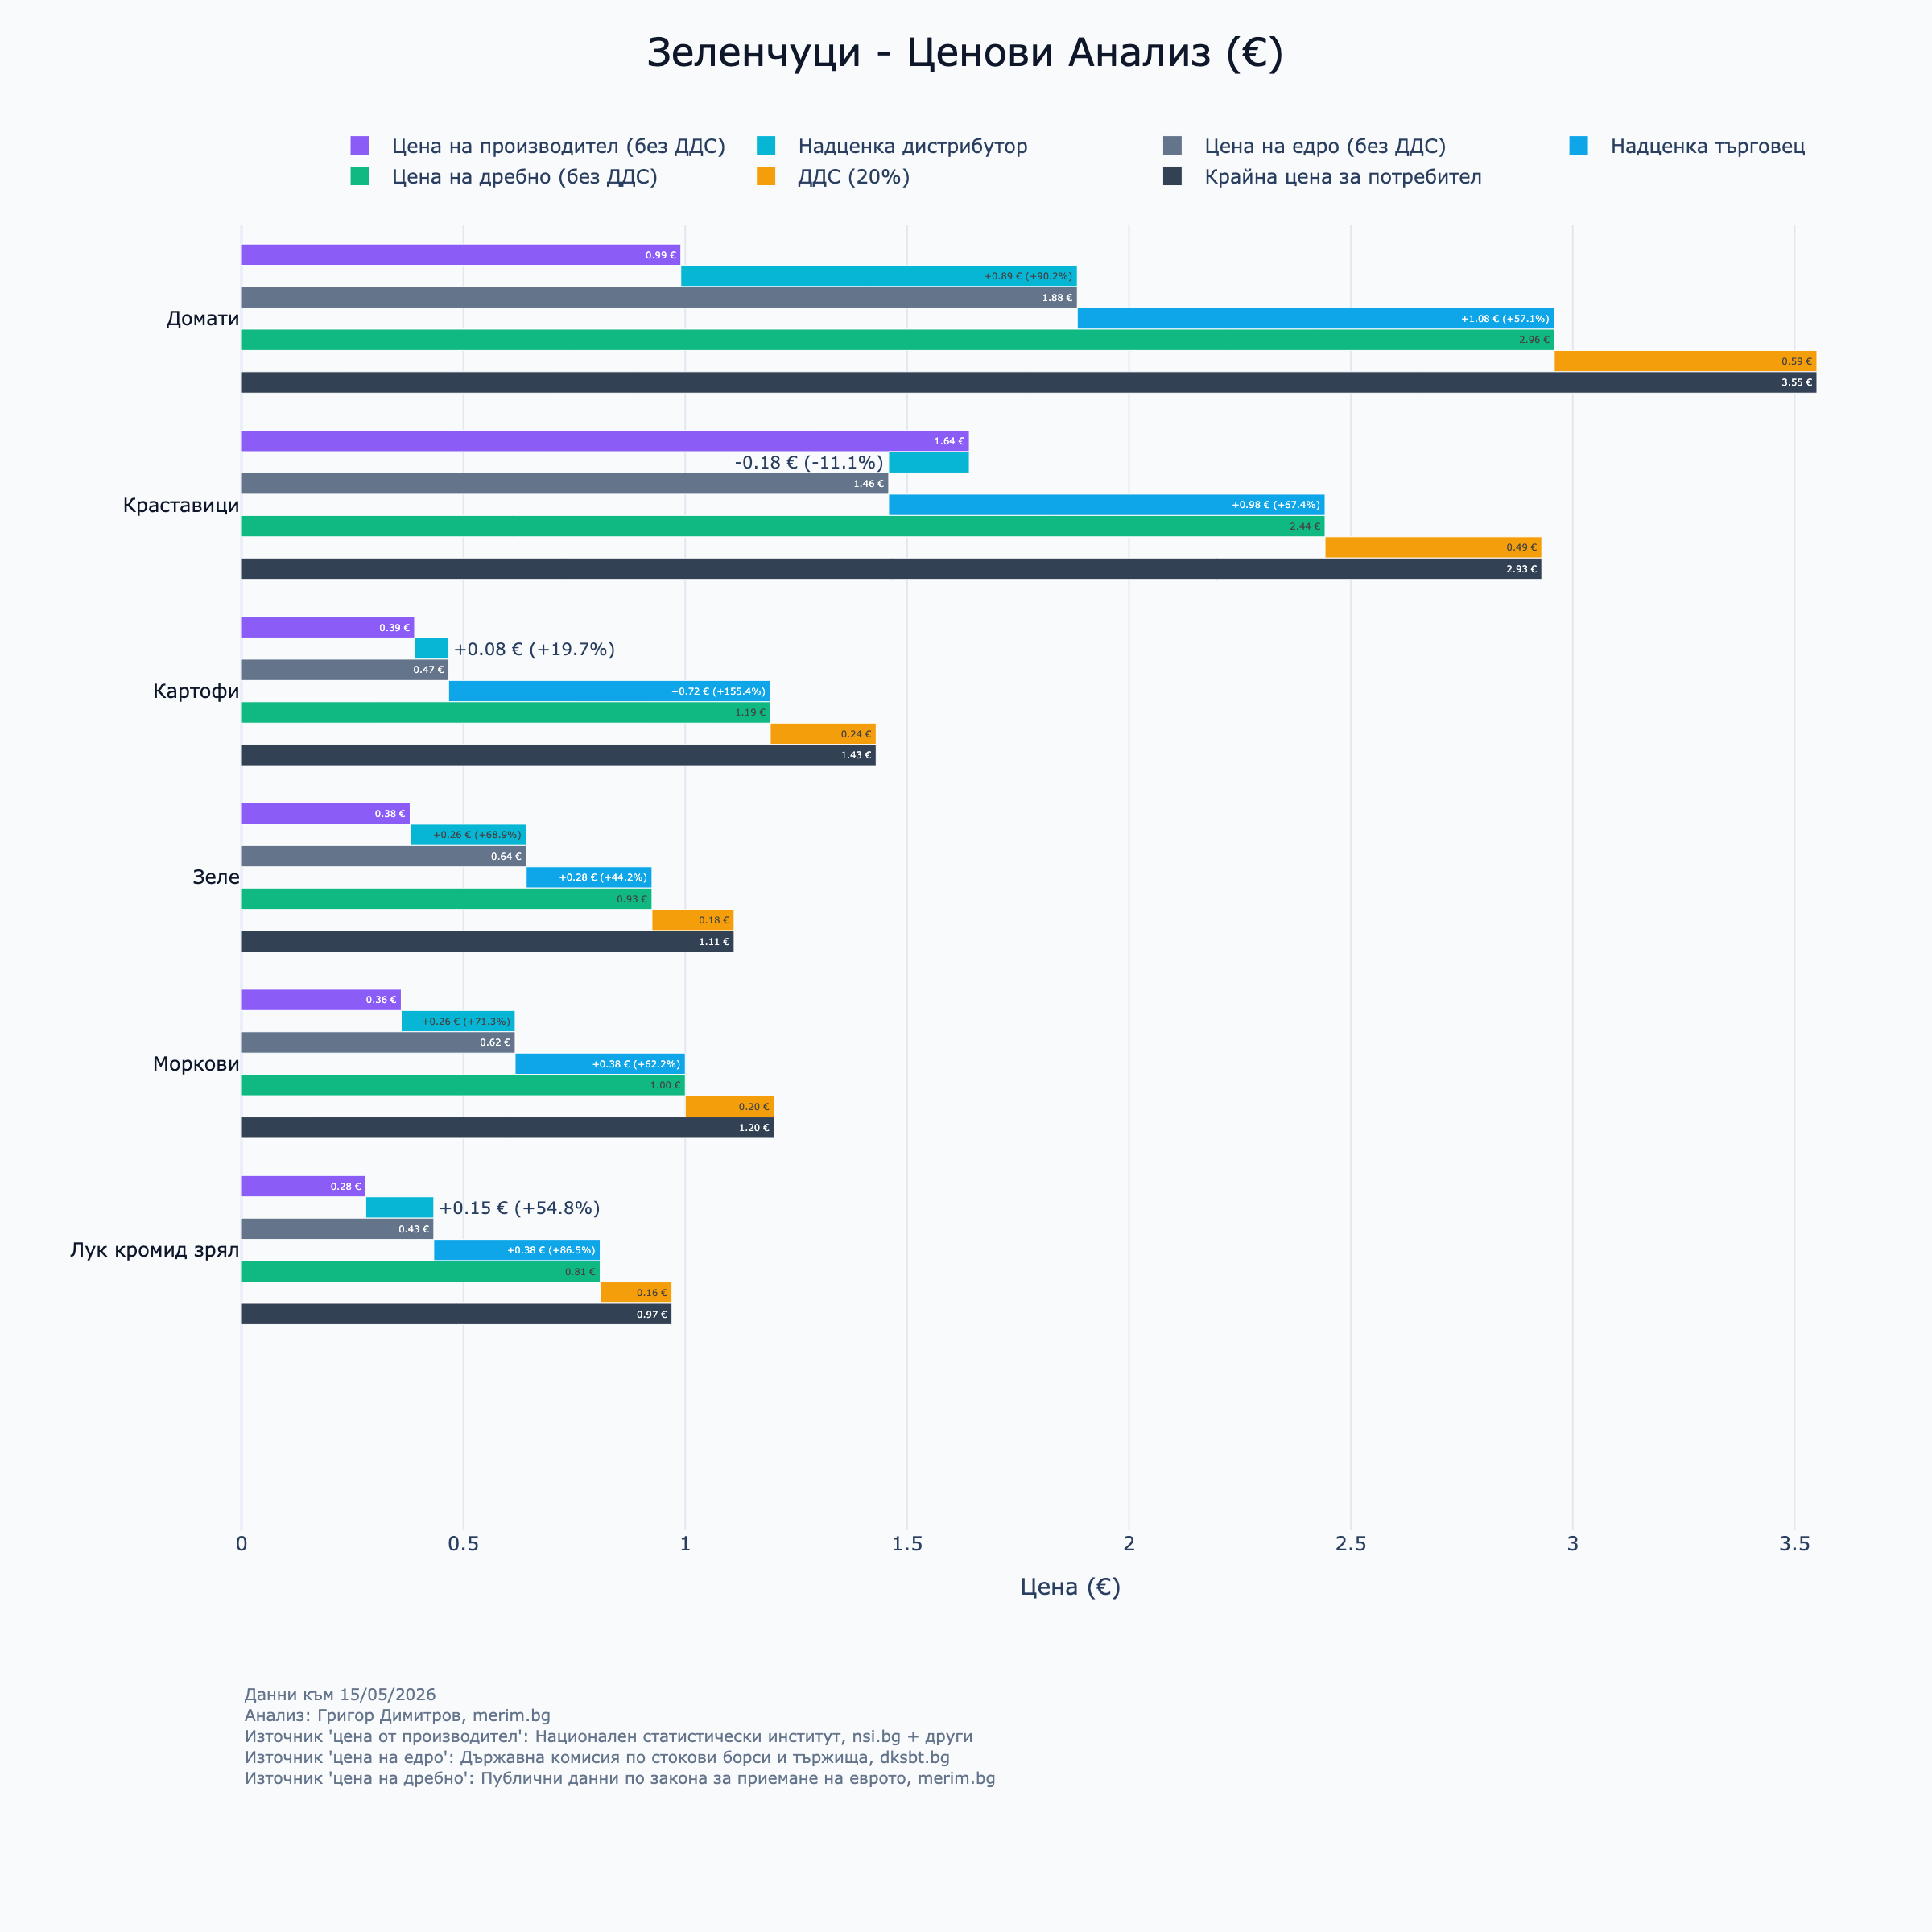
LEFT_FOOTNOTE = (
"Данни към 15/05/2026<br>"
"Анализ: Григор Димитров, merim.bg<br>"
"Източник 'цена от производител': Национален статистически институт, nsi.bg + други<br>"
"Източник 'цена на едро': Държавна комисия по стокови борси и тържища, dksbt.bg<br>"
"Източник 'цена на дребно': Публични данни по закона за приемане на еврото, merim.bg"
)
df = pd.read_csv('rawdata.csv')
df = df.rename(columns={
'produce_price': 'produce',
'wholesale_price': 'wholesale',
'retail_price': 'retail',
'wholesale_nomenclature': 'dksbt',
'retail_nomenclature': 'merim'
})
CATEGORY_NOTES = {
"Плодове и зеленчуци": "Забележка: Сезонни вариации при пресните продукти.",
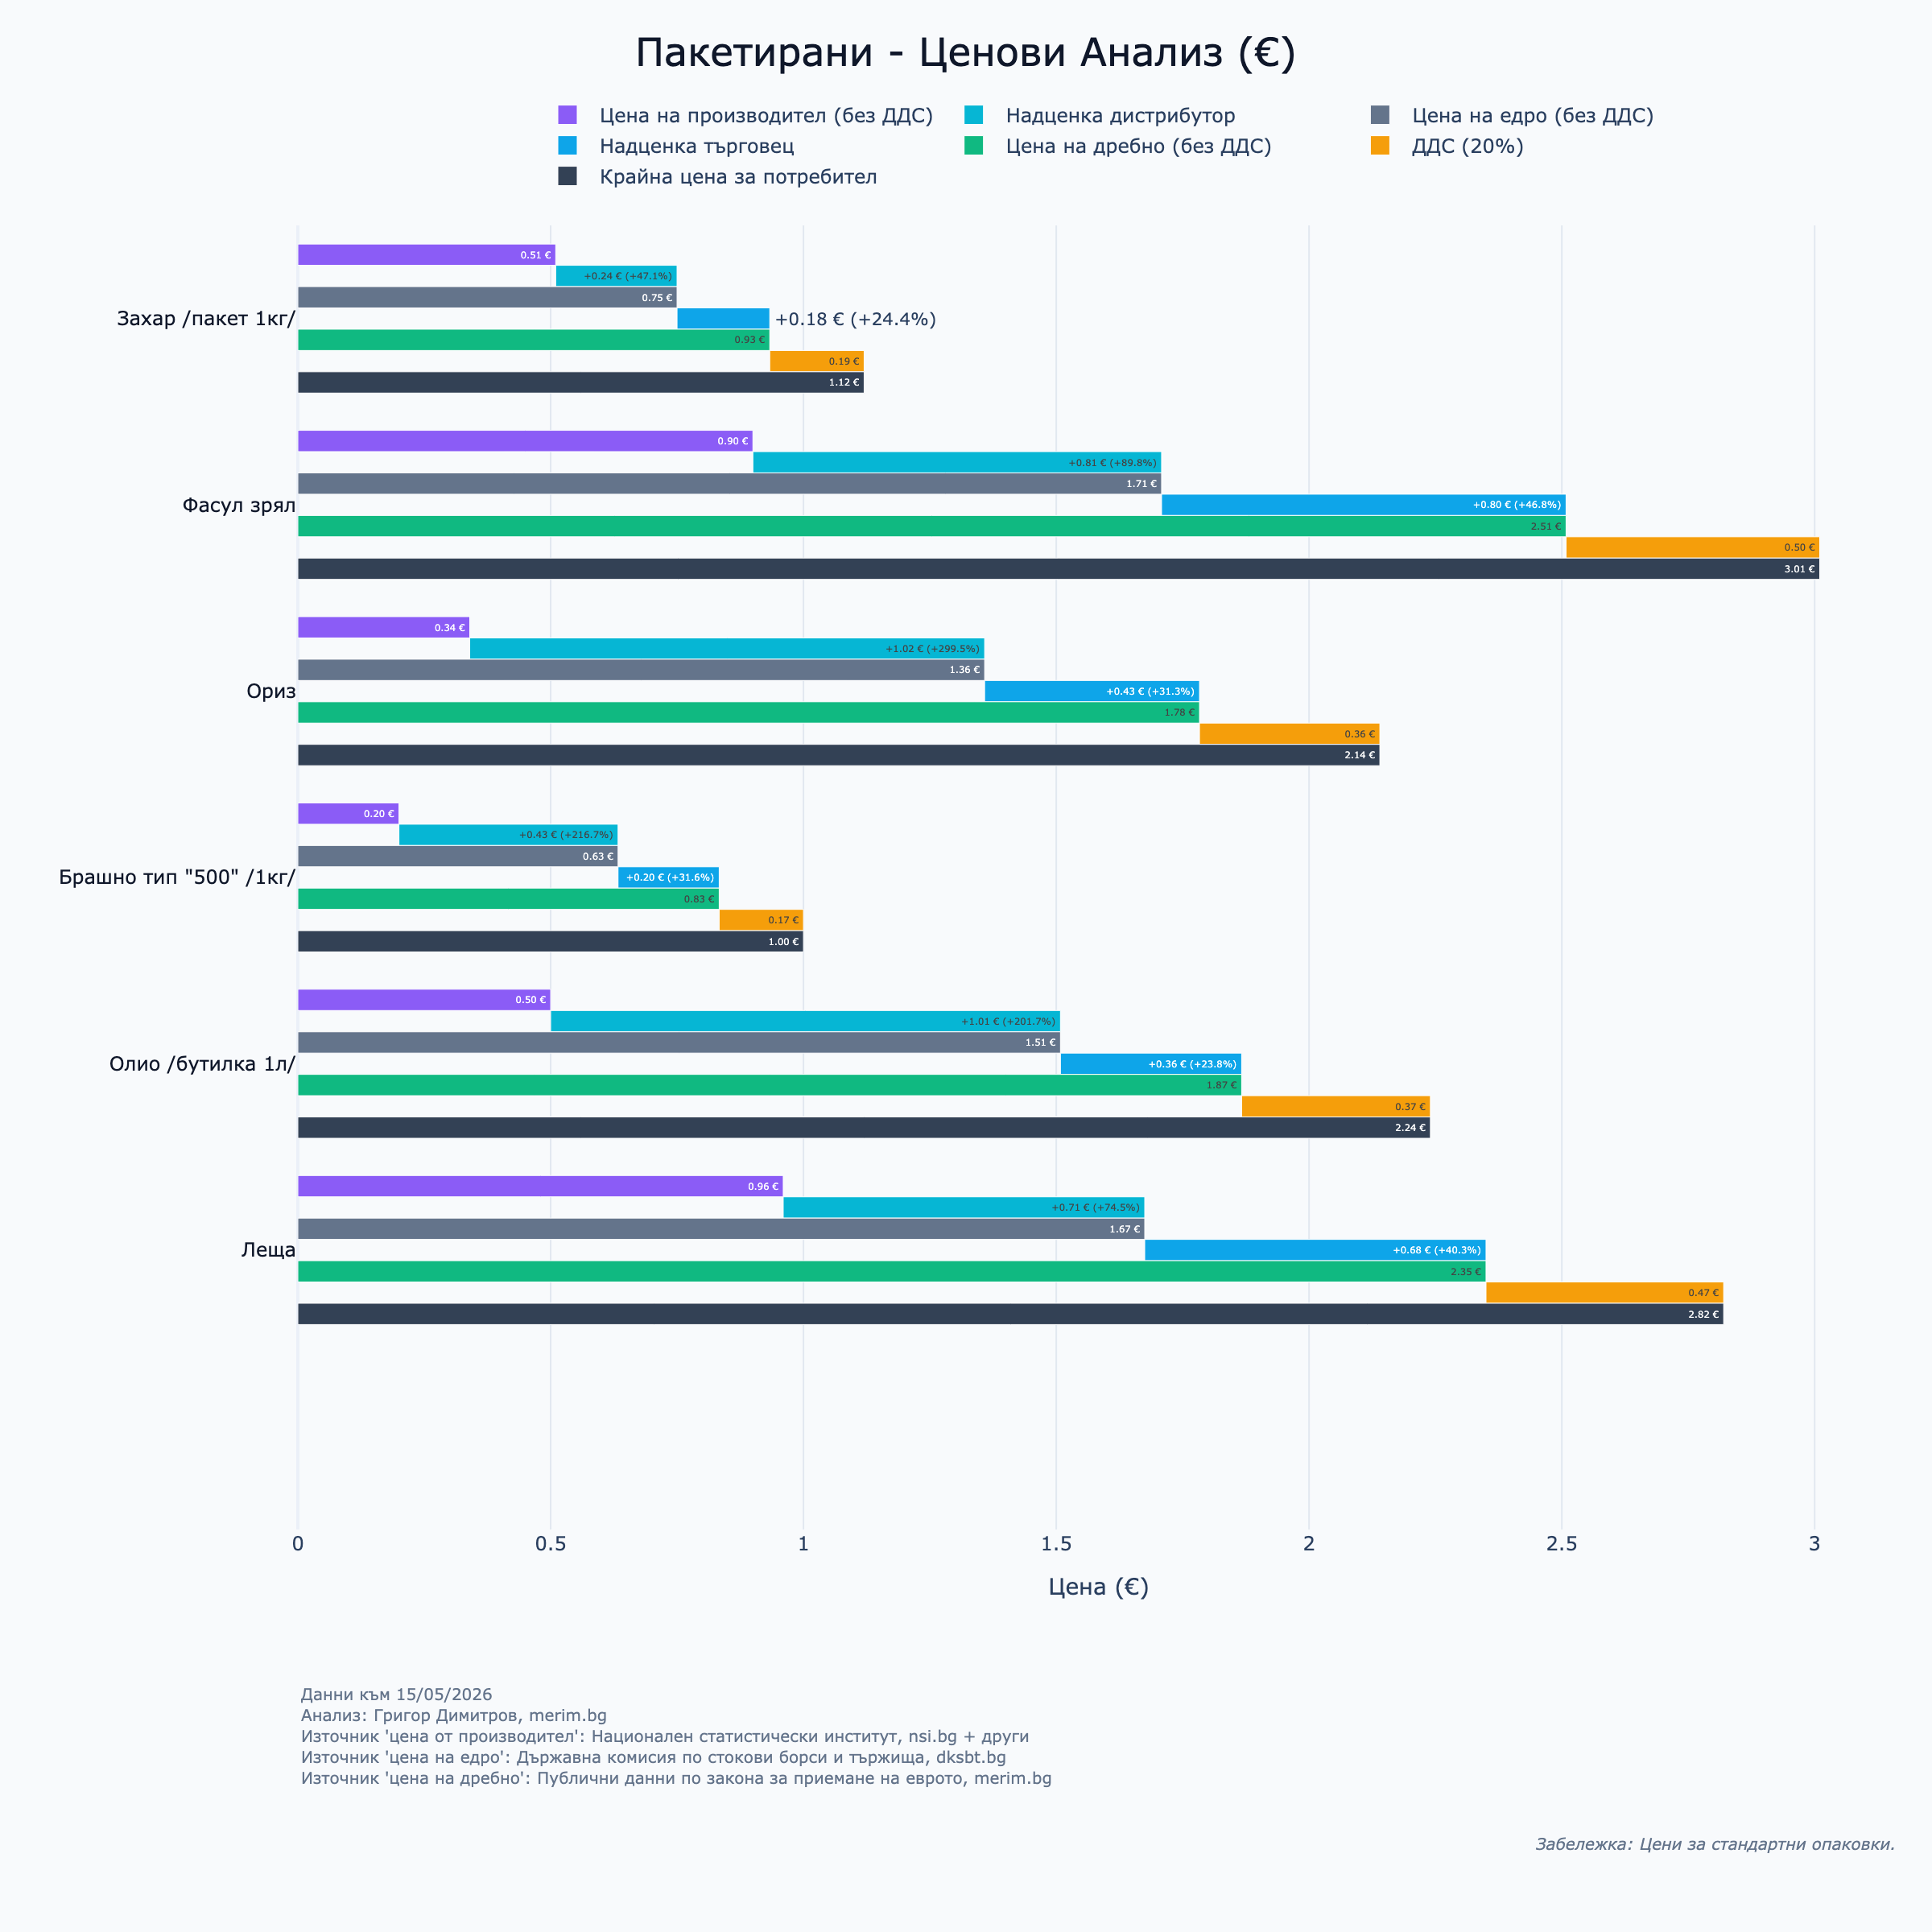
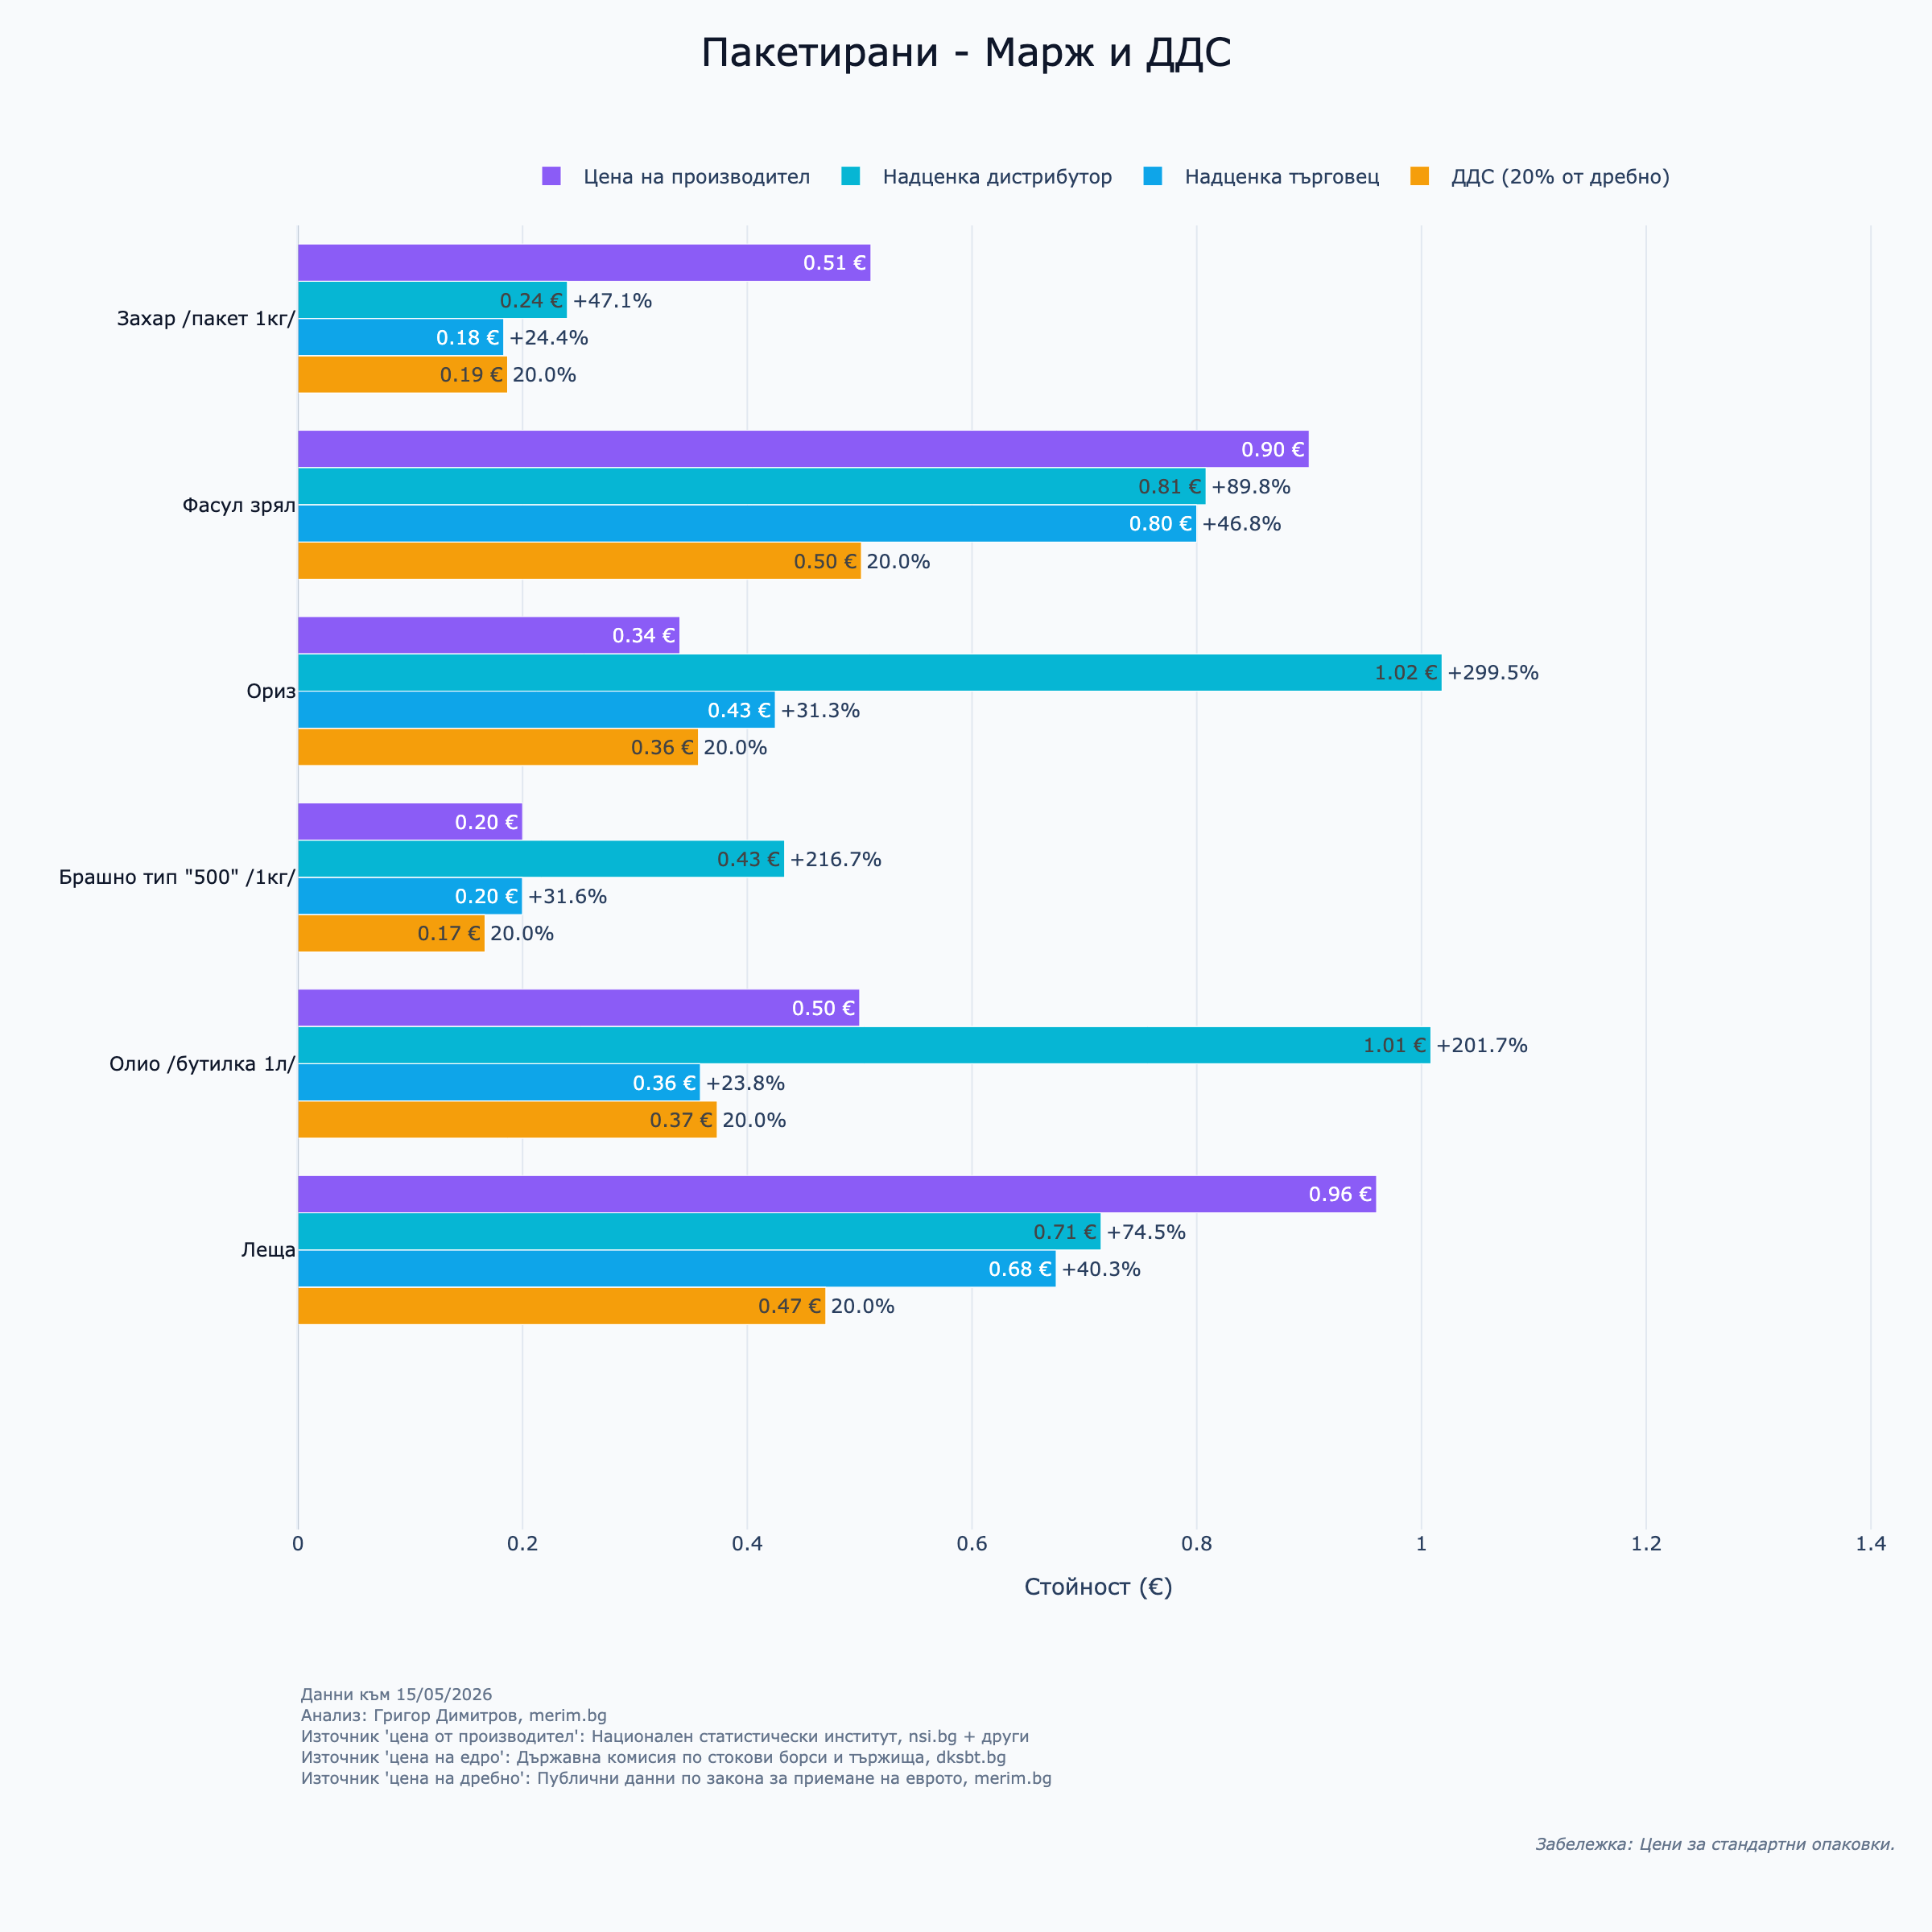
"Пакетирани": "Забележка: Цени за стандартни опаковки.",
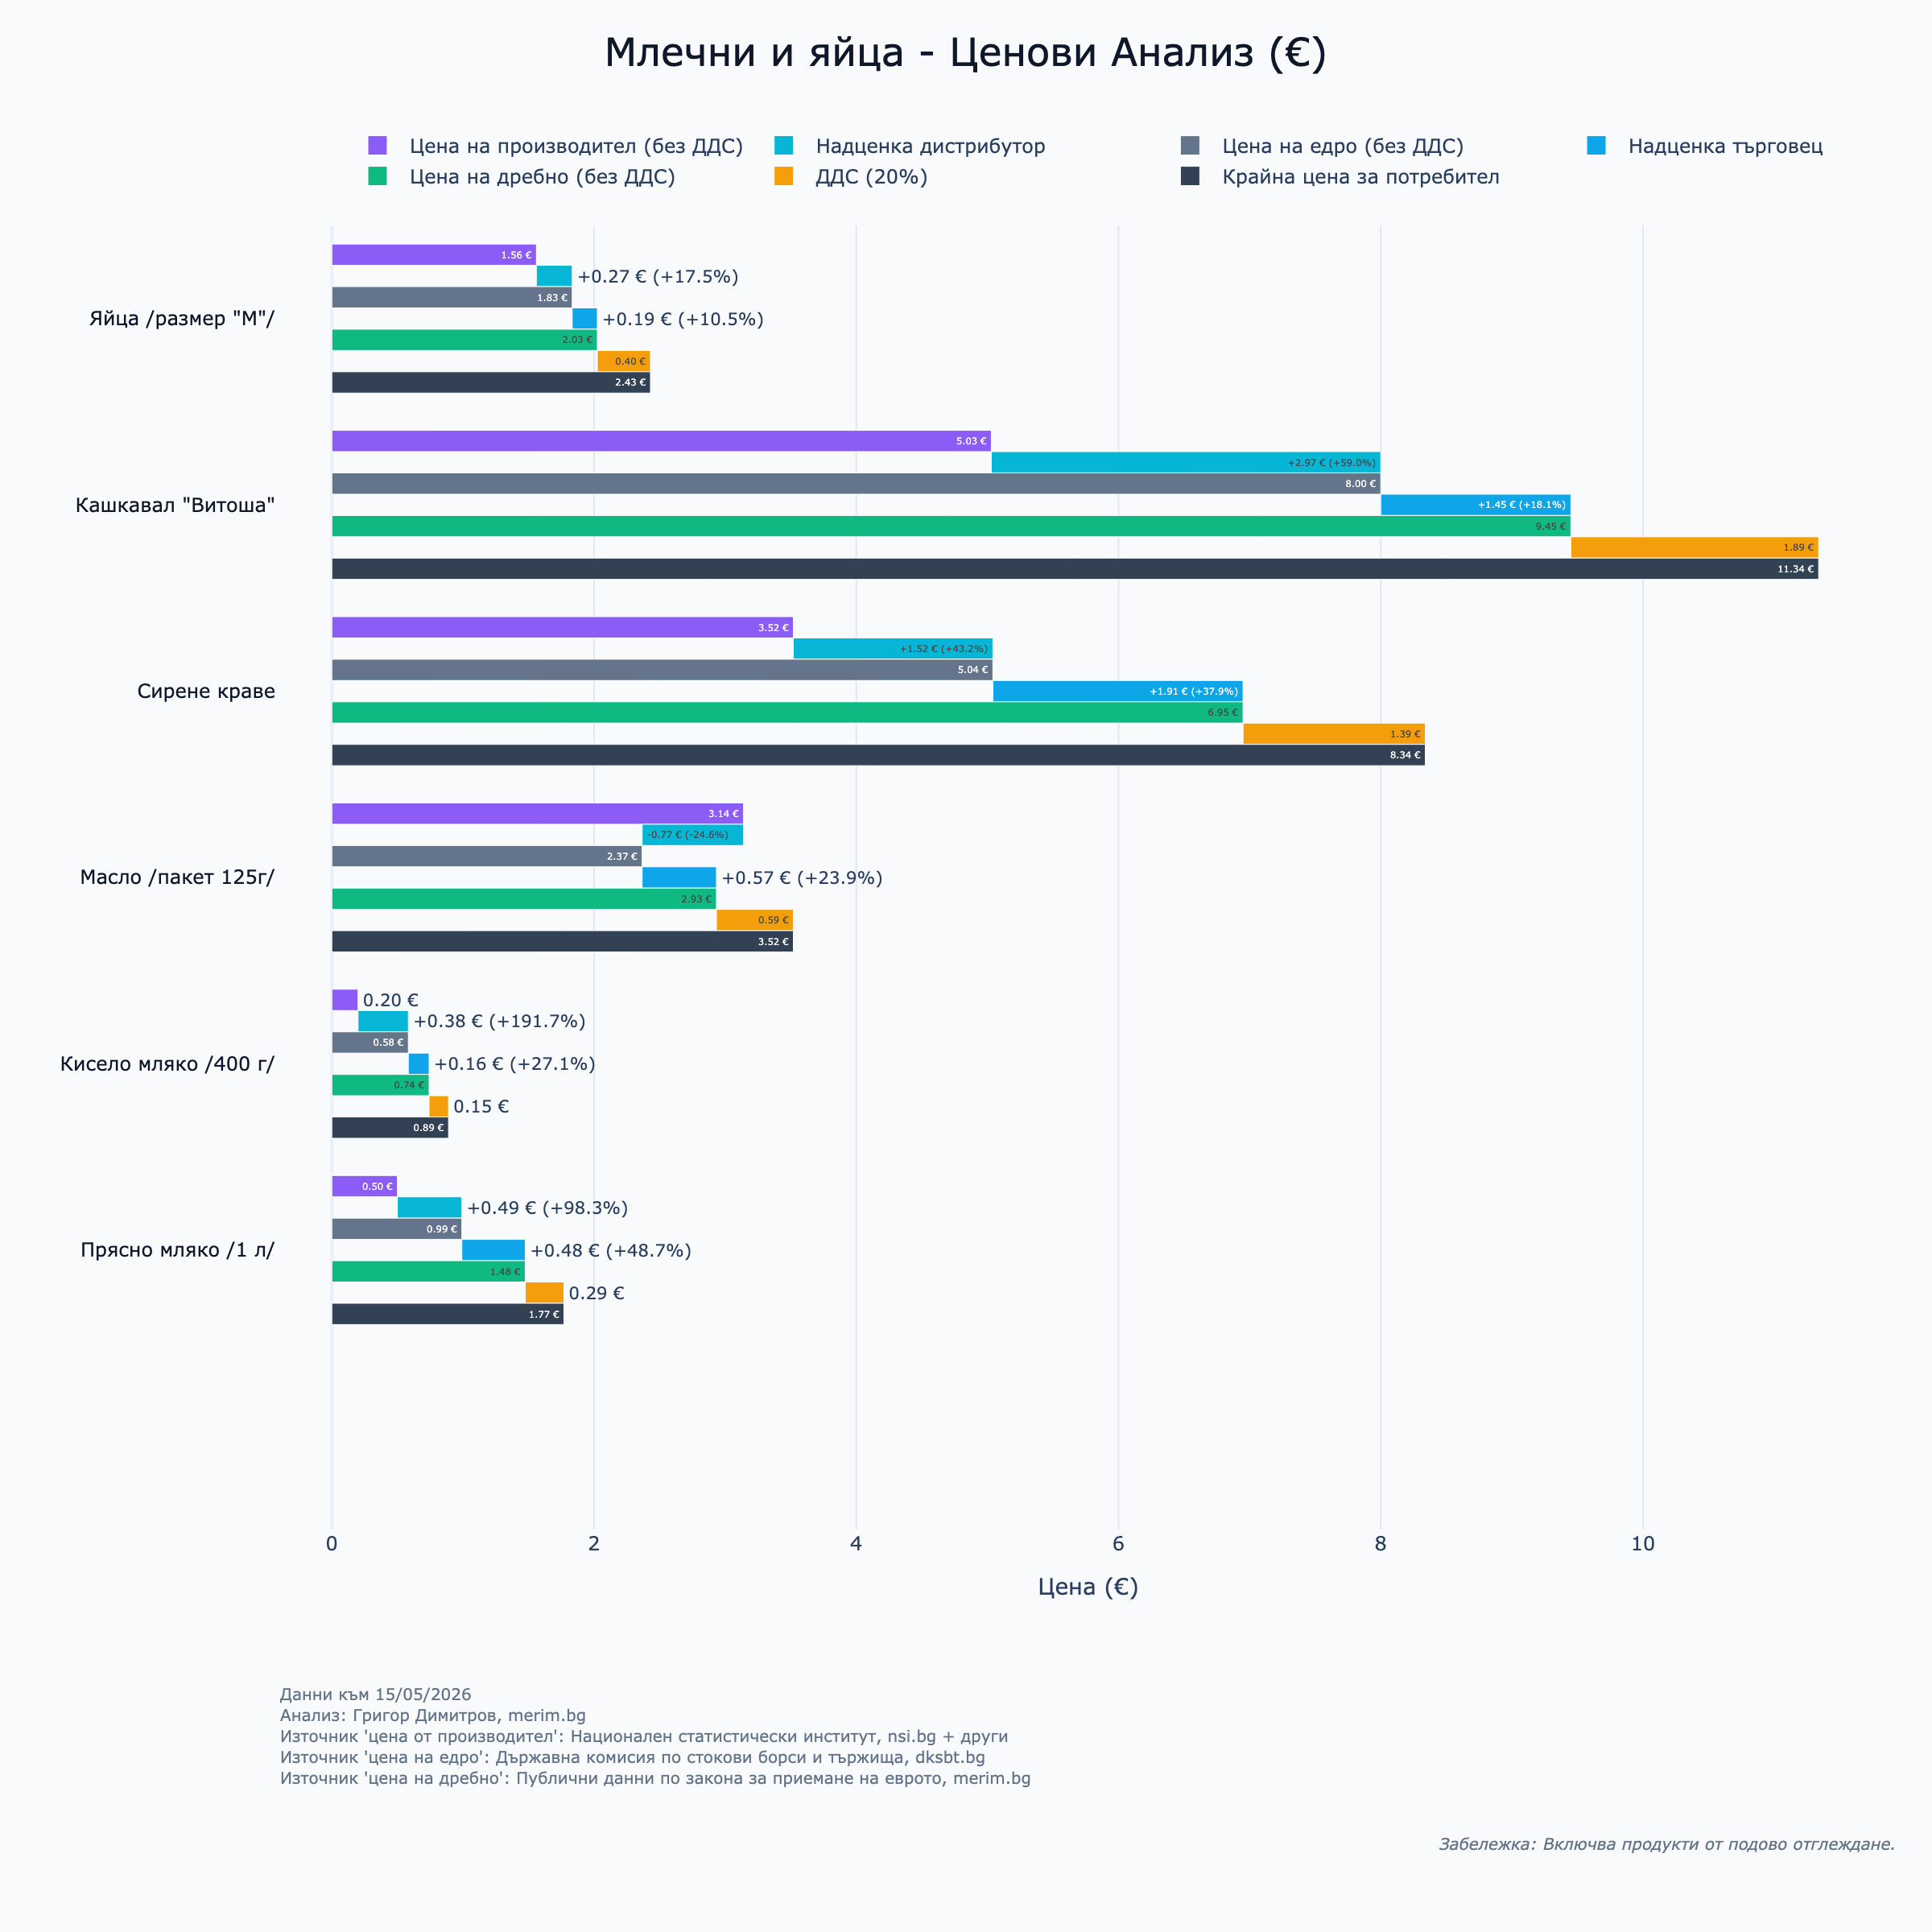
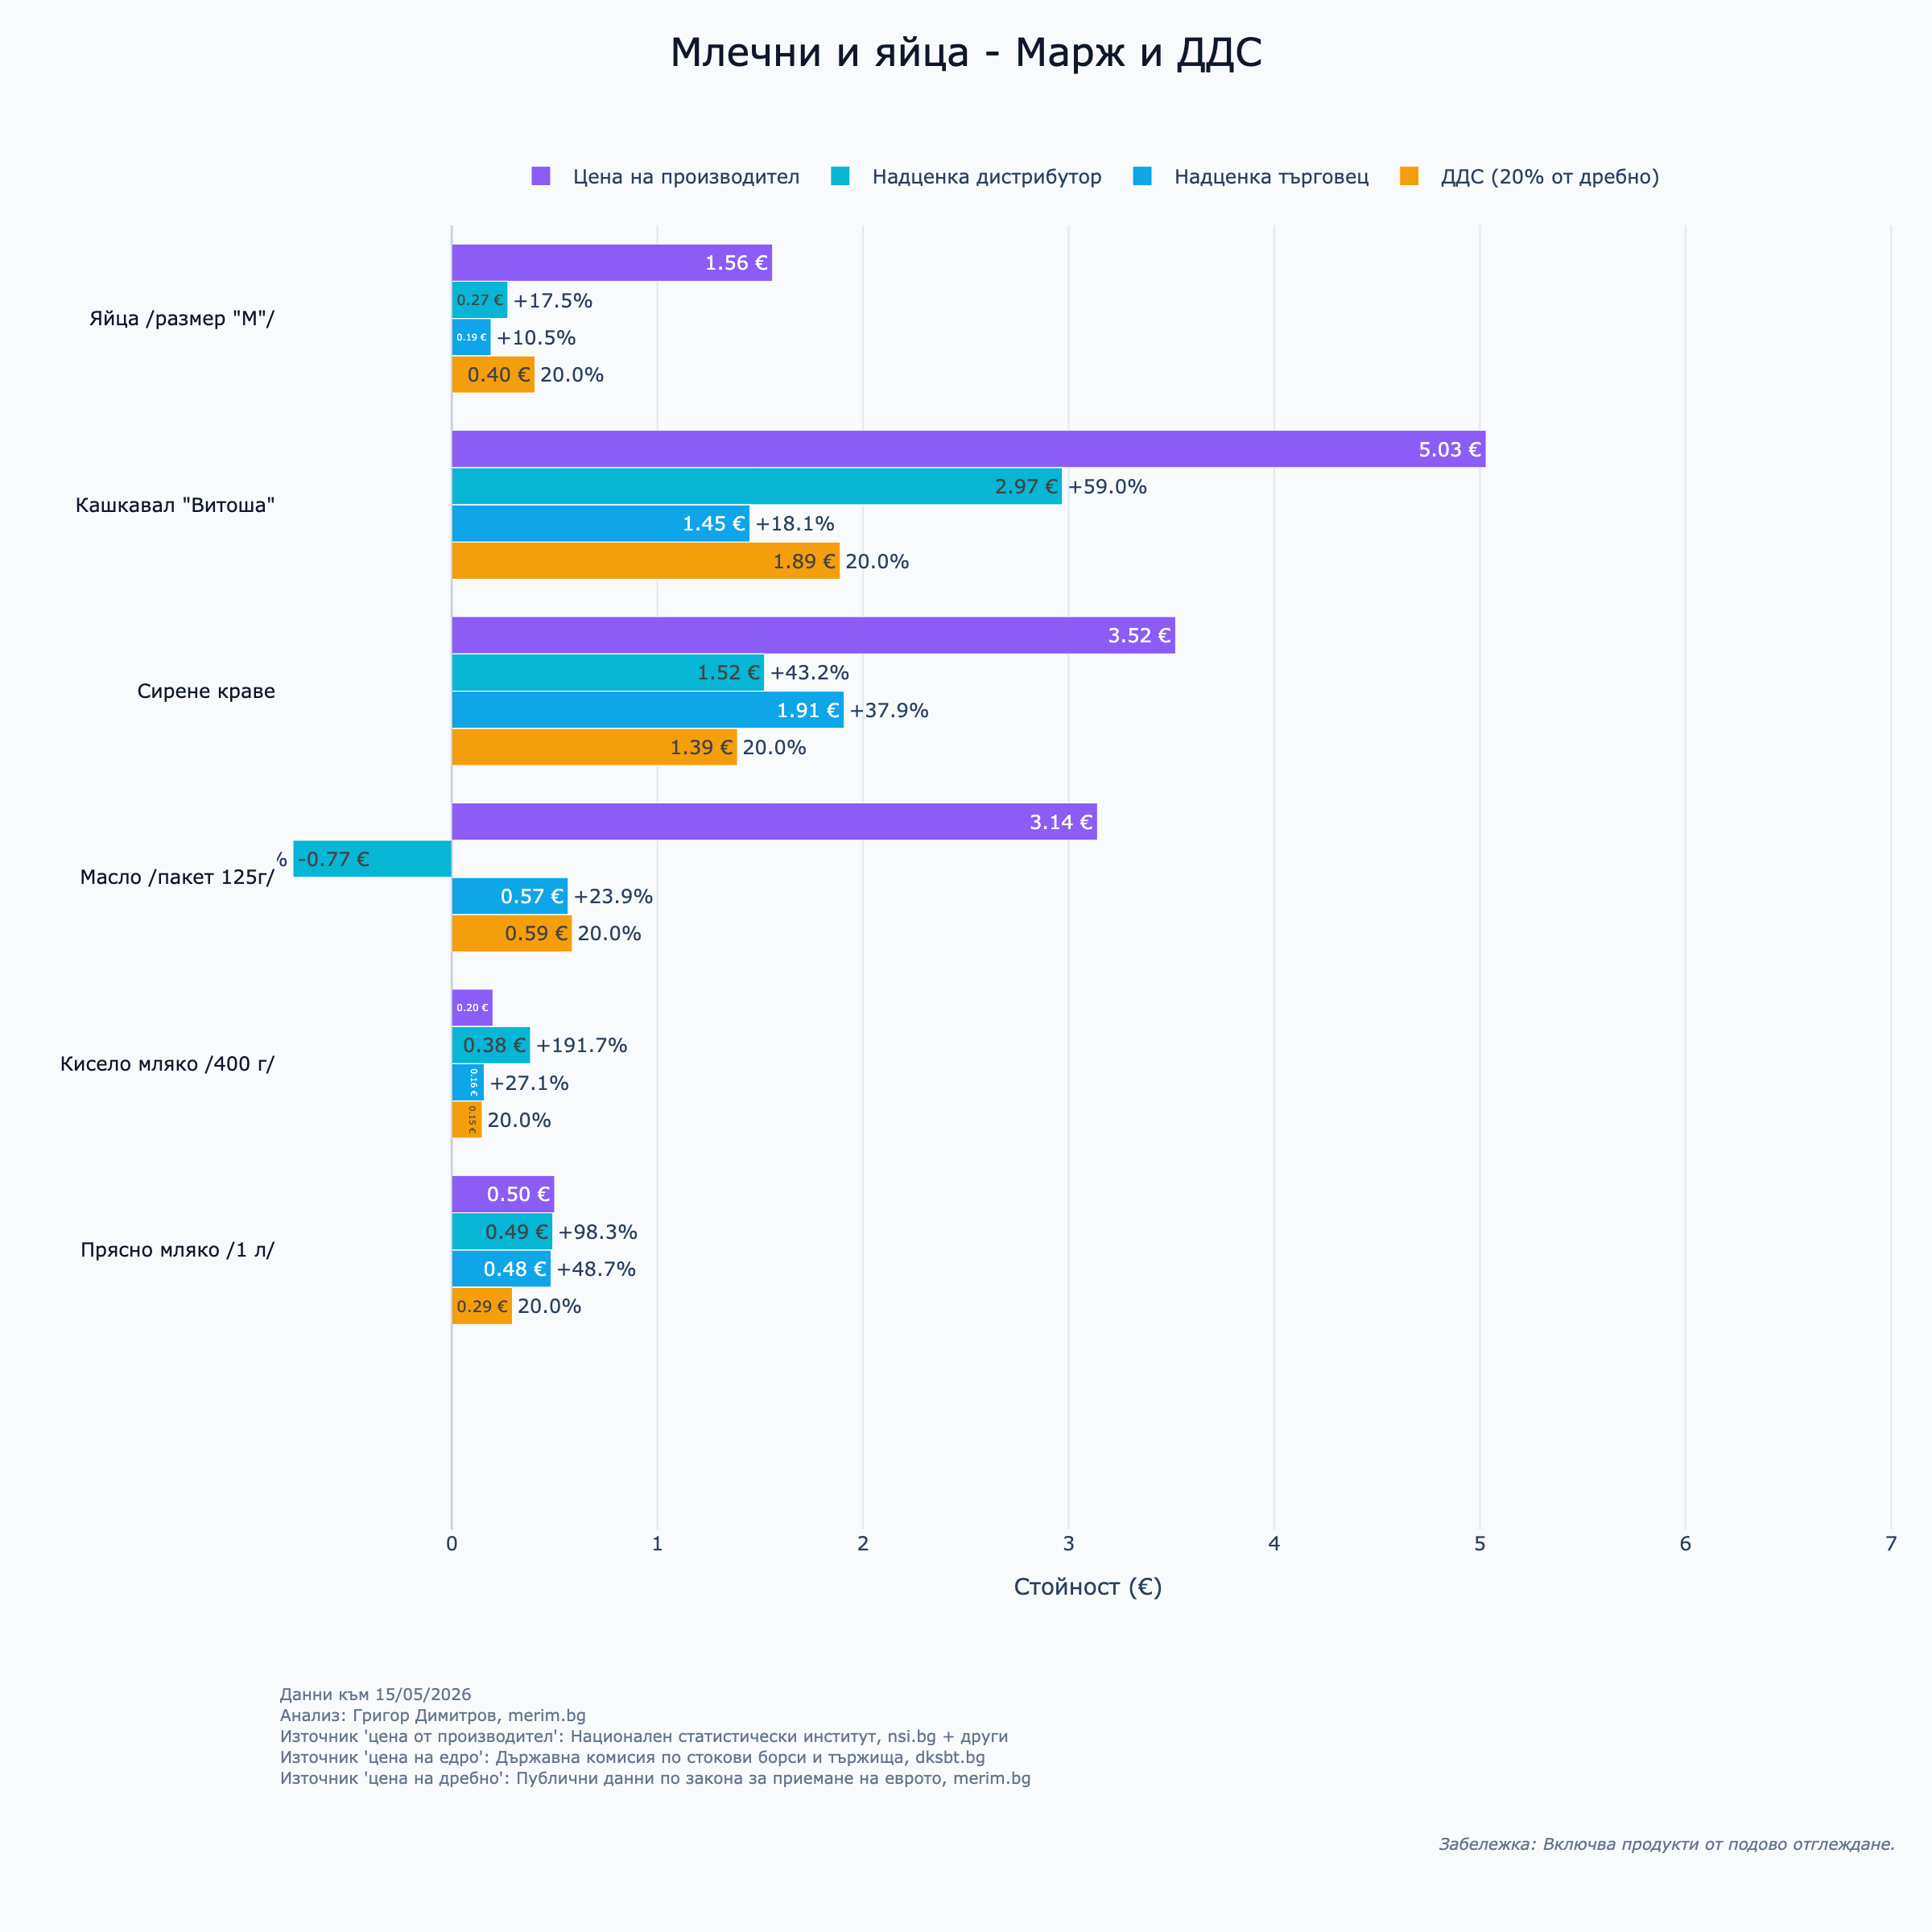
"Млечни и яйца": "Забележка: Включва продукти от подово отглеждане.",
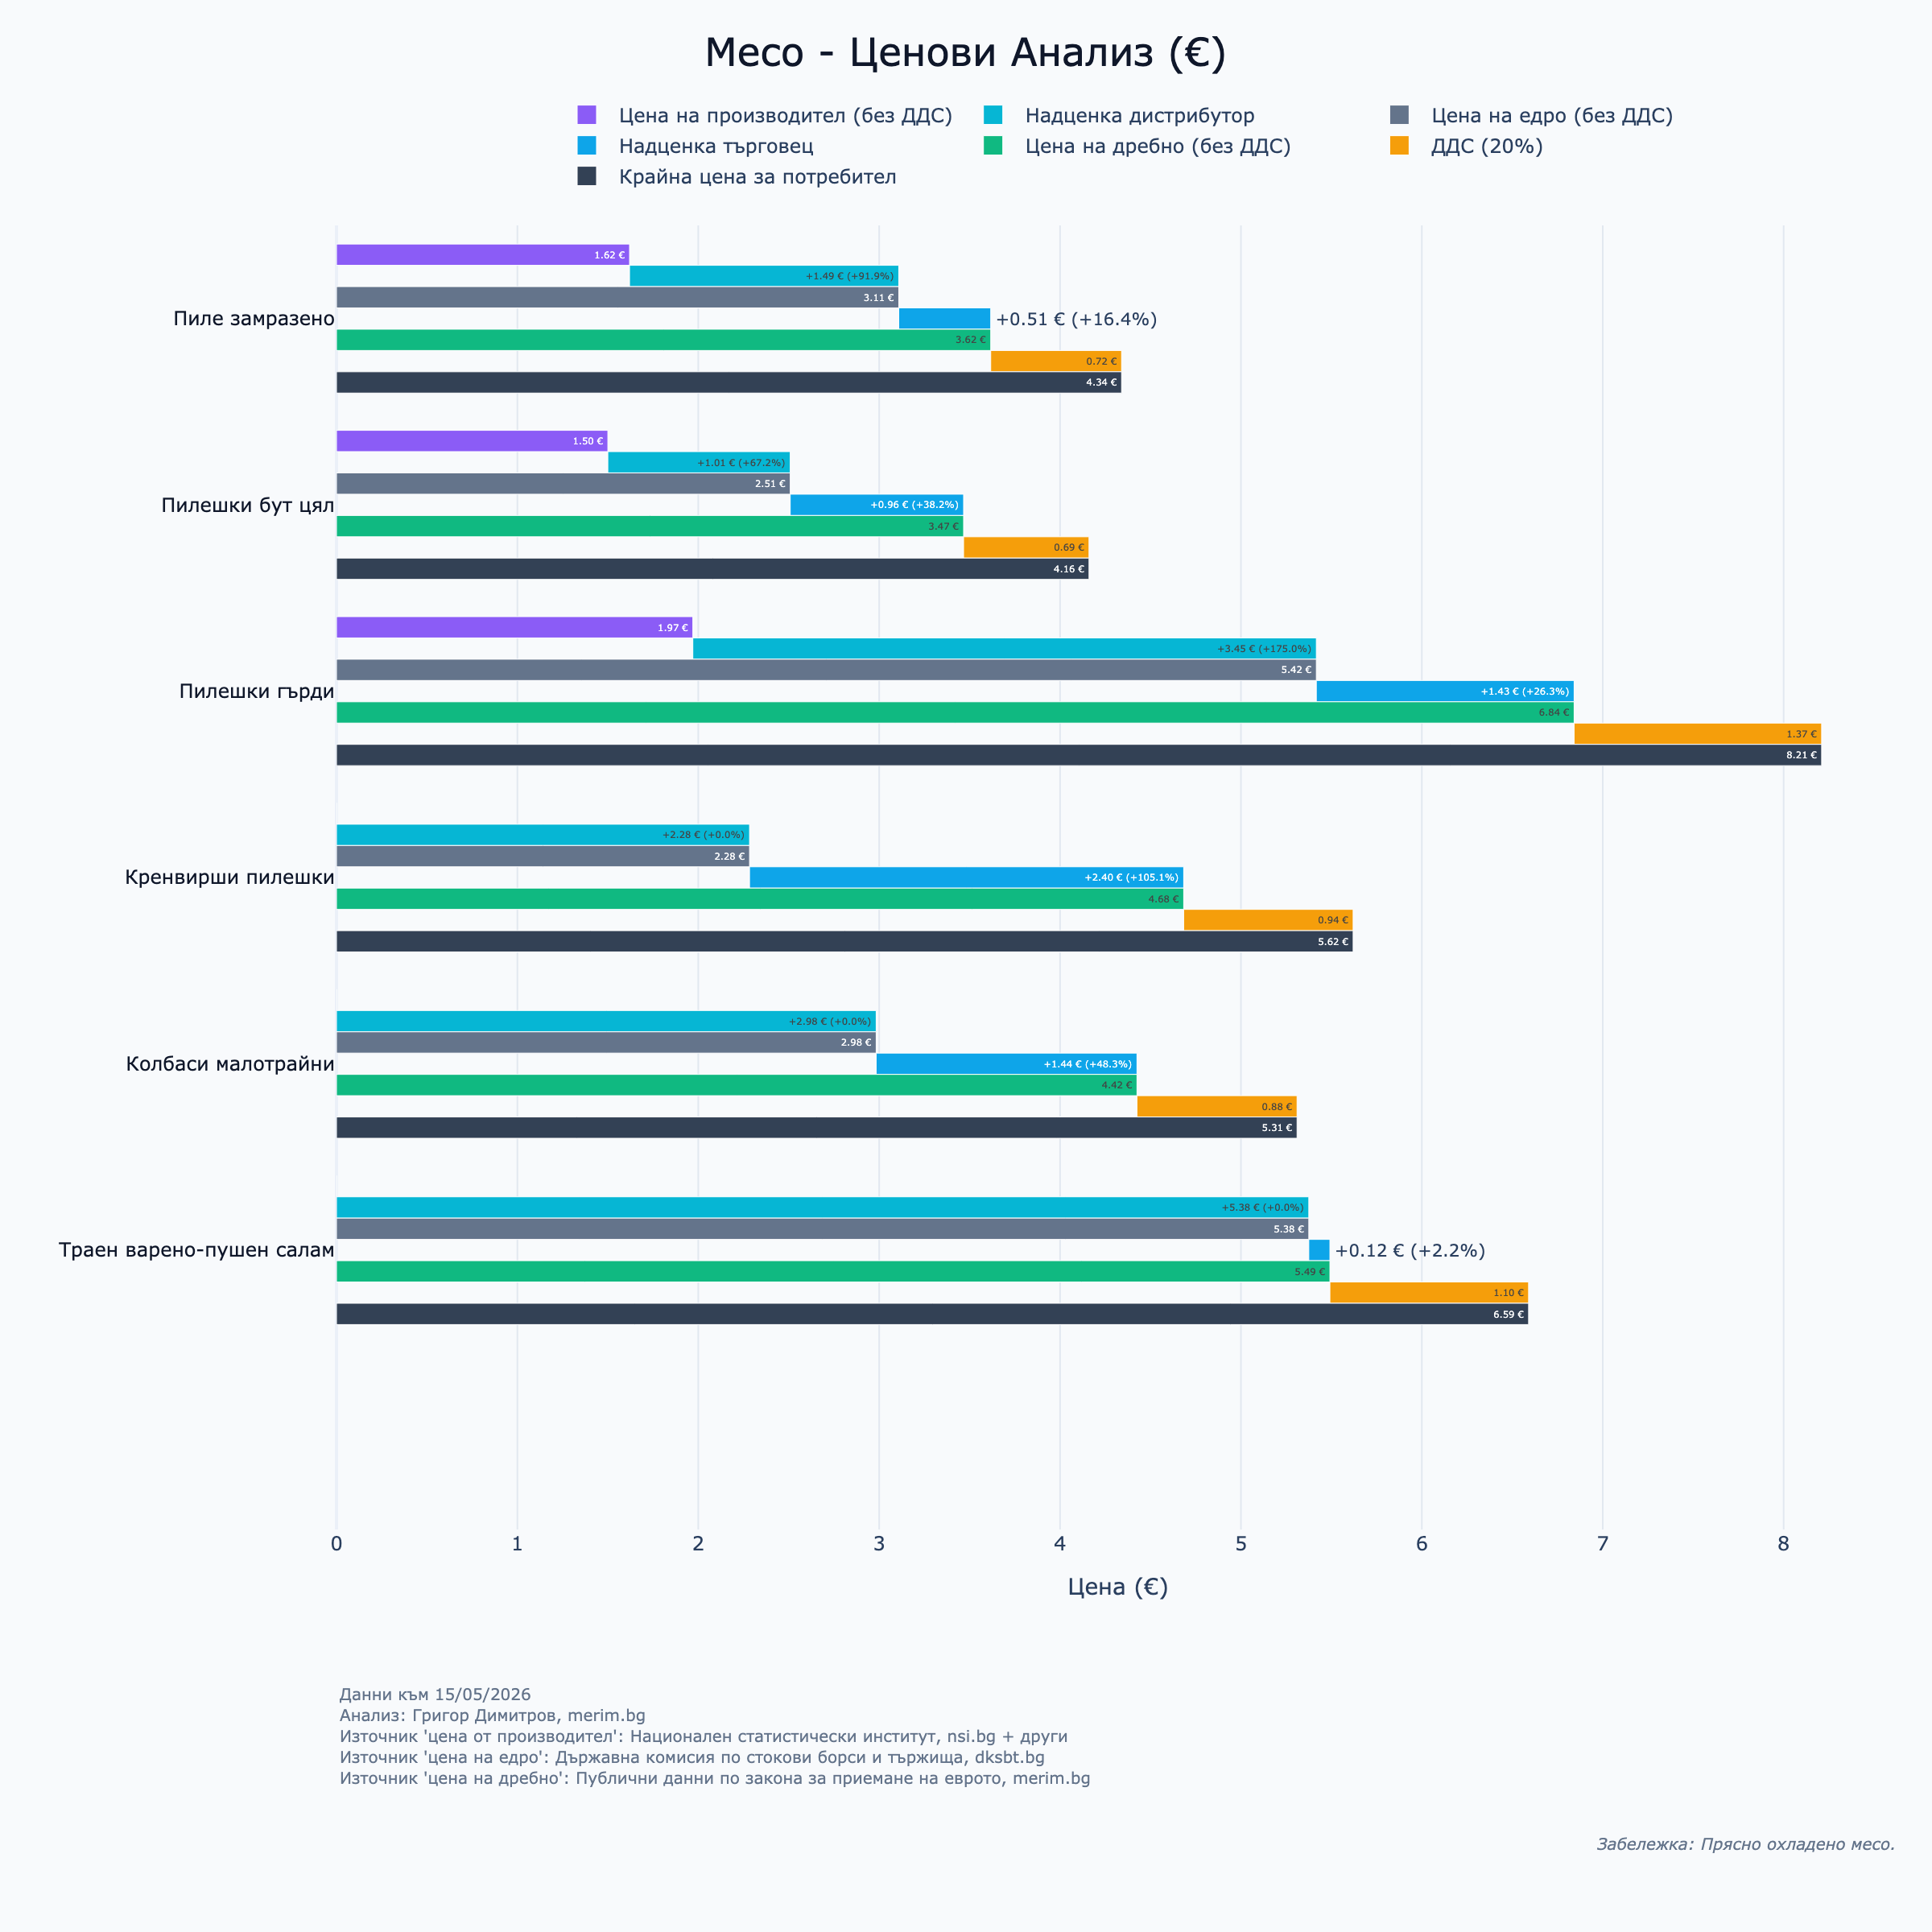
"Месо": "Забележка: Прясно охладено месо."
}
def plot_interactive_price_chart(category_data, category_name):
cat_df = category_data.copy()
y_indices = np.arange(len(cat_df))
labels_short = cat_df['dksbt'].values
labels_long = cat_df['merim'].values
# Raw values
vals_produce_net = cat_df['produce'].values # Already without VAT
vals_wholesale_gross = cat_df['wholesale'].values # Includes VAT
vals_retail_gross = cat_df['retail'].values # Includes VAT
# Net values
vals_produce = vals_produce_net
vals_wholesale = vals_wholesale_gross / 1.2
vals_retail = vals_retail_gross / 1.2
# Net margins
diffs = vals_retail - vals_wholesale
diffs_pct = (diffs / vals_wholesale) * 100
distributor_diffs = vals_wholesale - vals_produce
distributor_pct = np.divide(distributor_diffs, vals_produce, out=np.zeros_like(distributor_diffs), where=vals_produce!=0) * 100
tax_diffs = vals_retail_gross - vals_retail
# Wrap long labels for better display
wrapped_labels = ['<br>'.join(textwrap.wrap(label, width=40)) for label in labels_long]
# Common customdata for consistent tooltips
customdata_all = list(zip(
labels_long,
[f'{p:.2f}' for p in vals_produce],
[f'{d:+.2f}' for d in distributor_diffs],
[f'{p:+.1f}' for p in distributor_pct],
[f'{w:.2f}' for w in vals_wholesale],
[f'{d:+.2f}' for d in diffs],
[f'{p:+.1f}' for p in diffs_pct],
[f'{r:.2f}' for r in vals_retail],
[f'{t:.2f}' for t in tax_diffs],
[f'{rg:.2f}' for rg in vals_retail_gross]
))
common_hover = (
"<b>%{customdata[0]}</b><br>"
"Производител (без ДДС): %{customdata[1]} €<br>"
"Надценка дистрибутор: %{customdata[2]} € (%{customdata[3]}%)<br>"
"Цена на едро (без ДДС): %{customdata[4]} €<br>"
"Надценка търговец: %{customdata[5]} € (%{customdata[6]}%)<br>"
"Цена на дребно (без ДДС): %{customdata[7]} €<br>"
"ДДС (20%): %{customdata[8]} €<br>"
"Крайна цена: %{customdata[9]} €"
"<extra></extra>"
)
fig = go.Figure()
# 1. Produce (Net)
fig.add_trace(go.Bar(
y=y_indices, x=vals_produce, name='Цена на производител (без ДДС)', orientation='h',
marker_color=COLOR_PRODUCE,
text=[f'{p:.2f} €' for p in vals_produce], textposition='auto',
customdata=customdata_all,
hovertemplate=common_hover
))
# 2. Distributor Margin (Floating)
fig.add_trace(go.Bar(
y=y_indices, x=distributor_diffs, base=vals_produce, name='Надценка дистрибутор', orientation='h',
marker_color=COLOR_DISTRIBUTOR_MARGIN,
text=[f'{d:+.2f} € ({dp:+.1f}%)' for d, dp in zip(distributor_diffs, distributor_pct)], textposition='auto',
customdata=customdata_all,
hovertemplate=common_hover
))
# 3. Wholesale (Net)
fig.add_trace(go.Bar(
y=y_indices, x=vals_wholesale, name='Цена на едро (без ДДС)', orientation='h',
marker_color=COLOR_WHOLESALE,
text=[f'{w:.2f} €' for w in vals_wholesale], textposition='auto',
customdata=customdata_all,
hovertemplate=common_hover
))
# 4. Margin (Retail Margin, Floating)
margin_base = np.minimum(vals_wholesale, vals_retail)
margin_color = [COLOR_MARGIN_POS if d >= 0 else COLOR_MARGIN_NEG for d in diffs]
margin_text = [f'{d:+.2f} € ({dp:+.1f}%)' for d, dp in zip(diffs, diffs_pct)]
fig.add_trace(go.Bar(
y=y_indices, x=np.abs(diffs), base=margin_base, name='Надценка търговец', orientation='h',
marker_color=margin_color,
text=margin_text, textposition='auto',
customdata=customdata_all,
hovertemplate=common_hover
))
# 5. Retail (Net)
fig.add_trace(go.Bar(
y=y_indices, x=vals_retail, name='Цена на дребно (без ДДС)', orientation='h',
marker_color=COLOR_RETAIL,
text=[f'{r:.2f} €' for r in vals_retail], textposition='auto',
customdata=customdata_all,
hovertemplate=common_hover
))
# 6. Tax (Floating)
fig.add_trace(go.Bar(
y=y_indices, x=tax_diffs, base=vals_retail, name='ДДС (20%)', orientation='h',
marker_color=COLOR_TAX,
text=[f'{t:.2f} €' for t in tax_diffs], textposition='auto',
customdata=customdata_all,
hovertemplate=common_hover
))
# 7. Consumer Price (Gross)
fig.add_trace(go.Bar(
y=y_indices, x=vals_retail_gross, name='Крайна цена за потребител', orientation='h',
marker_color='#334155', # Slate 700 for clear distinction
text=[f'{rg:.2f} €' for rg in vals_retail_gross], textposition='auto',
customdata=customdata_all,
hovertemplate=common_hover
))
fig.update_layout(
barmode='group',
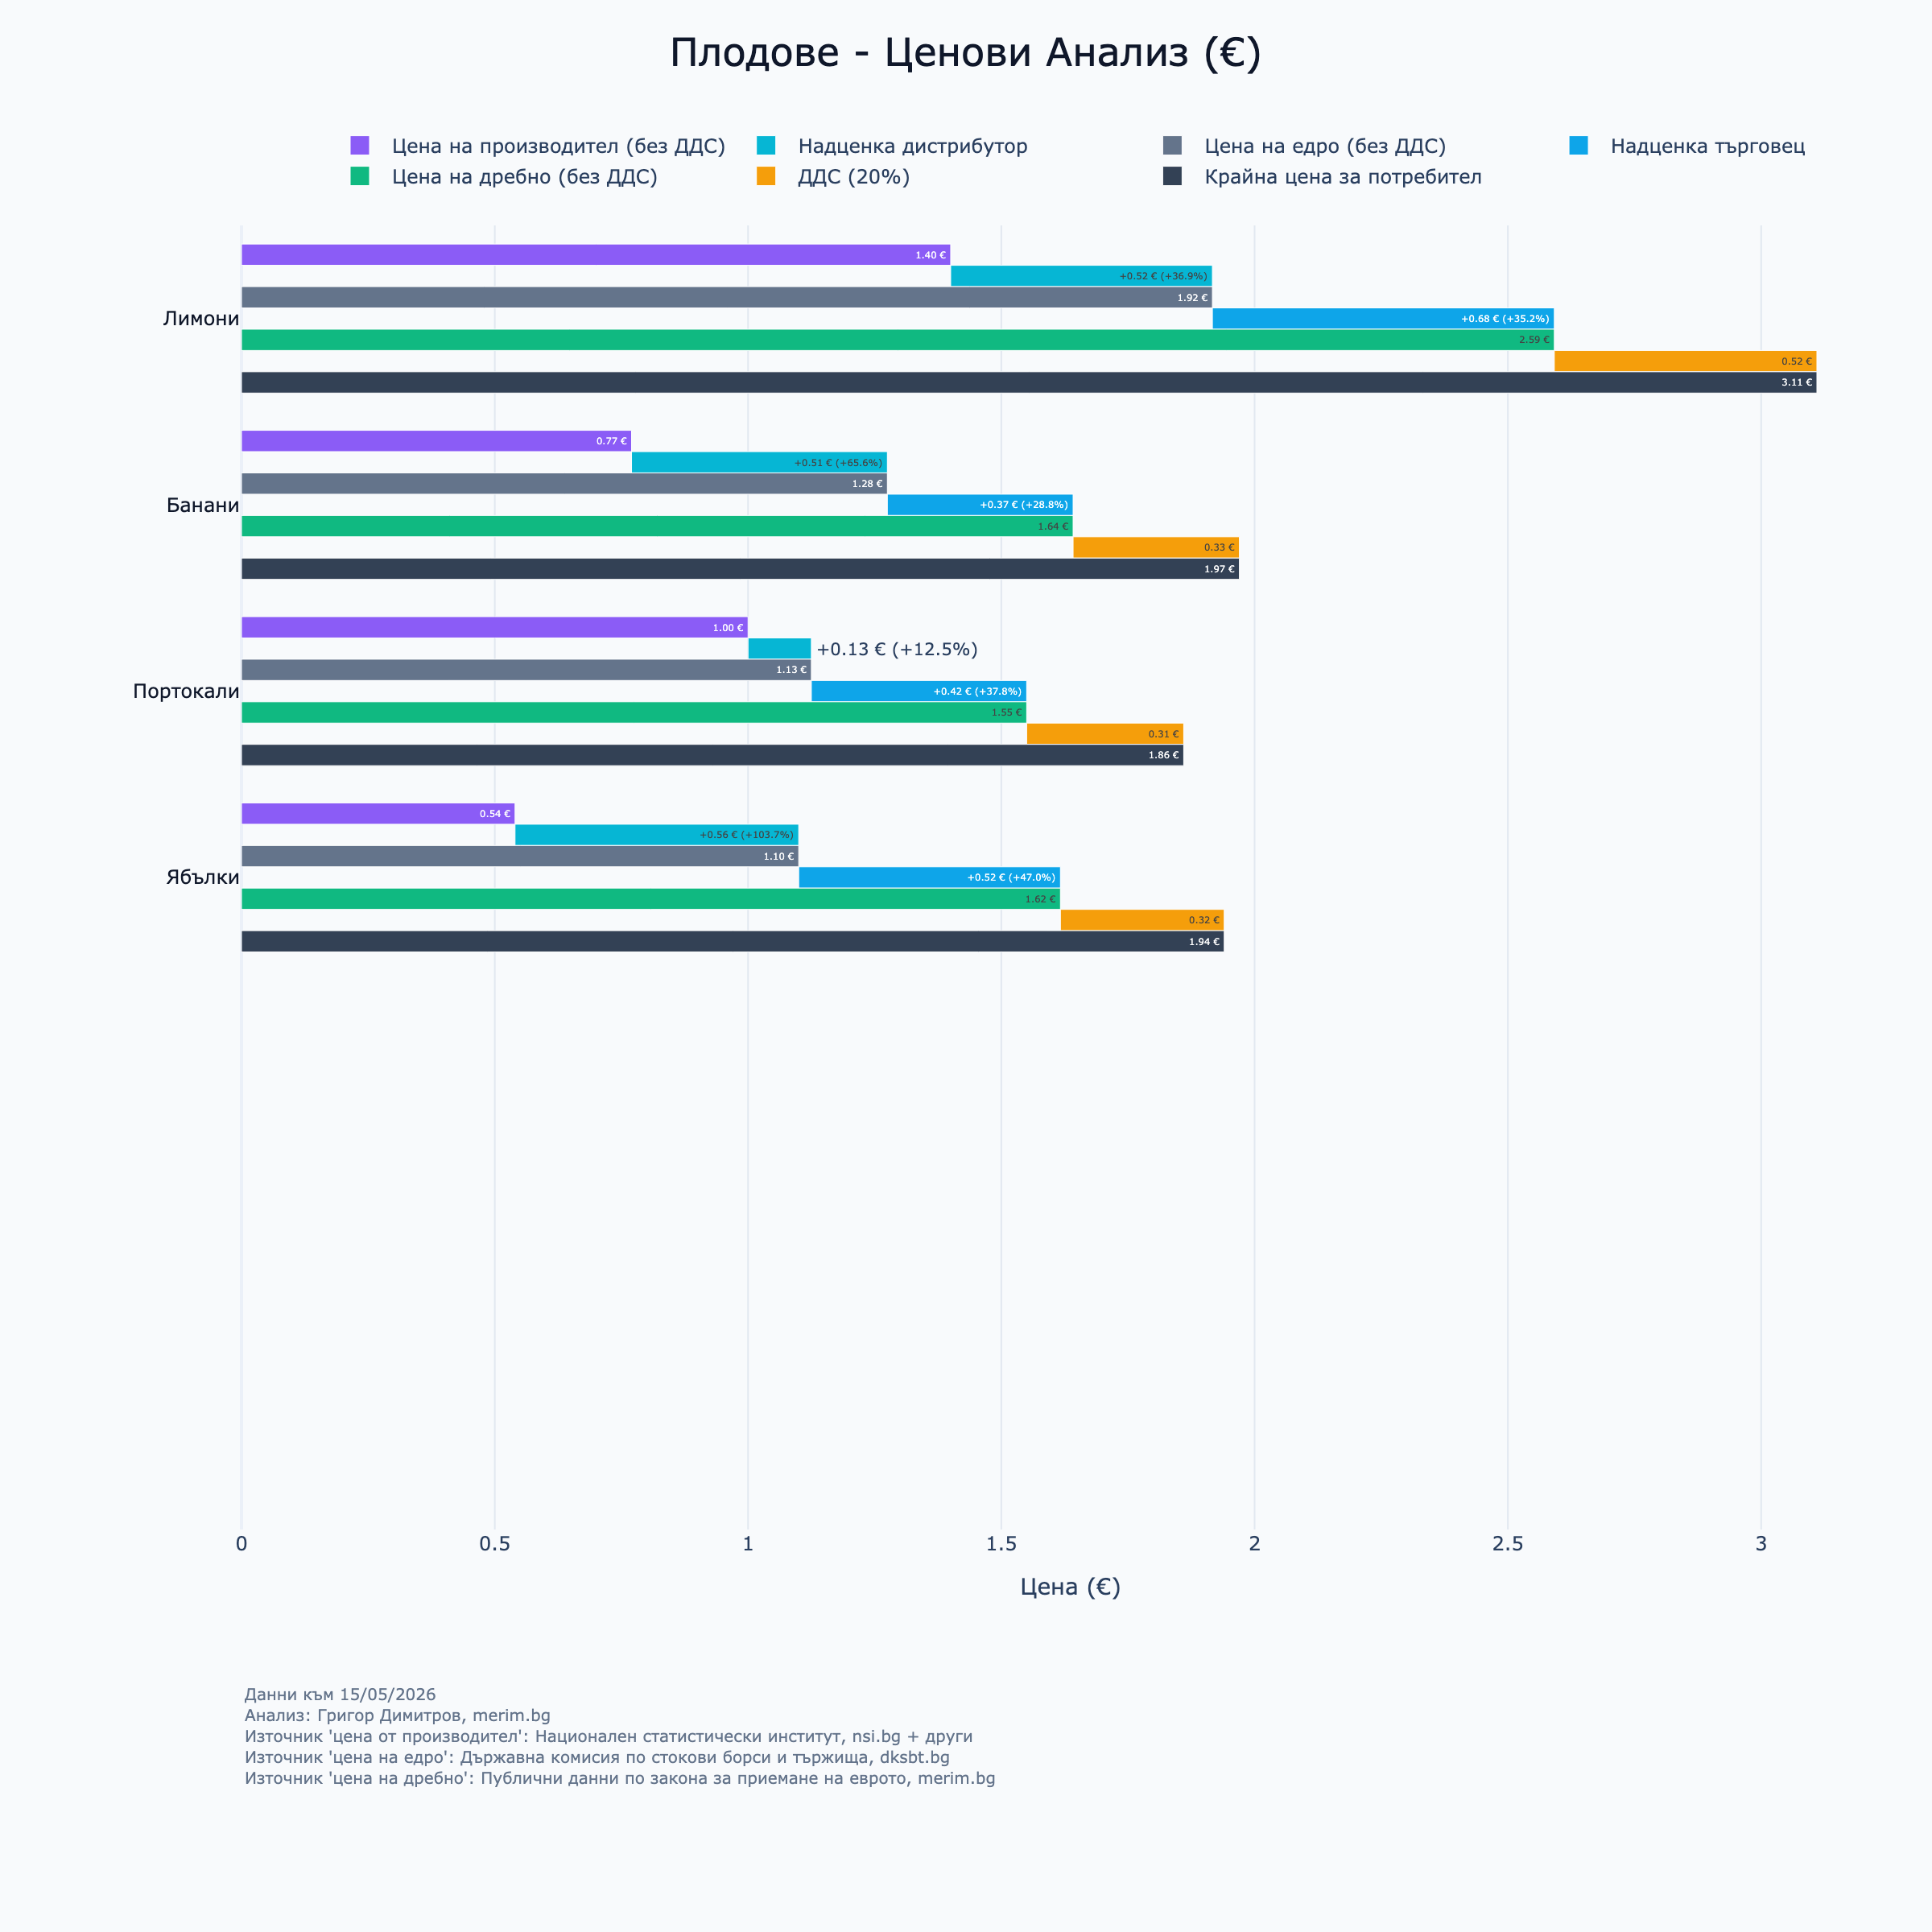
title=dict(text=f"{category_name} - Ценови Анализ (€)", font=dict(size=24, color=TEXT_MAIN), x=0.5, y=0.98),
height=FIXED_HEIGHT,
template='plotly_white',
showlegend=True,
legend=dict(orientation='h', yanchor='bottom', y=1.02, xanchor='center', x=0.5),
margin=dict(l=150, r=20, t=140, b=250),
plot_bgcolor=BG_COLOR,
paper_bgcolor=BG_COLOR,
xaxis=dict(title='Цена (€)', showgrid=True, gridcolor='#E2E8F0'),
yaxis=dict(
title='', showgrid=False, tickfont=dict(color=TEXT_MAIN),
tickmode='array', tickvals=y_indices, ticktext=labels_short,
range=[MAX_ITEMS - 0.5, -0.5], autorange=False, fixedrange=True
)
)
fig.add_annotation(
x=0, y=-0.2, xref='paper', yref='paper',
text=LEFT_FOOTNOTE, showarrow=False,
font=dict(size=10, color=TEXT_MUTED), align='left', xanchor='left', yanchor='bottom'
)
fig.add_annotation(
x=1, y=-0.25, xref='paper', yref='paper',
text=f"<i>{CATEGORY_NOTES.get(category_name, '')}</i>", showarrow=False,
font=dict(size=10, color=TEXT_MUTED), align='right', xanchor='right', yanchor='bottom'
)
fig.show()
return fig
def plot_interactive_normalized_margin_chart(category_data, category_name):
cat_df = category_data.copy()
y_indices = np.arange(len(cat_df))
labels_short = cat_df['dksbt'].values
labels_long = cat_df['merim'].values
vals_produce = cat_df['produce'].values
vals_w = cat_df['wholesale'].values
vals_r = cat_df['retail'].values
# Calculate Net Margin and Tax amounts
# Produce price is already net, strip 20% VAT from wholesale and retail
net_produce = vals_produce
net_w = vals_w / 1.2
net_r = vals_r / 1.2
# Net margins
distributor_vals = net_w - net_produce
margin_vals = net_r - net_w
# Total VAT in the final price
tax_vals = vals_r - net_r
# Percentages for labels (Markup % over the net cost)
distributor_pct = np.divide(distributor_vals, net_produce, out=np.zeros_like(distributor_vals), where=net_produce!=0) * 100
margin_pct = (margin_vals / net_w) * 100
# Wrap long labels for better display
wrapped_labels = ['<br>'.join(textwrap.wrap(label, width=40)) for label in labels_long]
# Calculate dynamic x-axis range
max_val = max(np.max(margin_vals), np.max(tax_vals), np.max(vals_produce), np.max(distributor_vals)) if len(margin_vals) > 0 else 1
min_val = min(np.min(margin_vals), np.min(distributor_vals), 0) if len(margin_vals) > 0 else 0
x_max = max_val * 1.4 # Give extra space for labels
x_min = min_val * 1.1 if min_val < 0 else 0
# Common customdata for consistent tooltips
customdata_all = list(zip(
labels_long,
[f'{p:.2f}' for p in vals_produce],
[f'{v:.2f}' for v in distributor_vals],
[f'{p:+.1f}' for p in distributor_pct],
[f'{w:.2f}' for w in vals_w],
[f'{v:.2f}' for v in margin_vals],
[f'{p:+.1f}' for p in margin_pct],
[f'{r:.2f}' for r in vals_r],
[f'{v:.2f}' for v in tax_vals]
))
common_hover = (
"<b>%{customdata[0]}</b><br>"
"Производител: %{customdata[1]} €<br>"
"Надценка дистрибутор (без ДДС): %{customdata[2]} € (%{customdata[3]}%)<br>"
"Цена на едро: %{customdata[4]} €<br>"
"Надценка търговец (без ДДС): %{customdata[5]} € (%{customdata[6]}%)<br>"
"ДДС (в крайната цена): %{customdata[8]} €<br>"
"Цена на дребно: %{customdata[7]} €"
"<extra></extra>"
)
fig = go.Figure()
# 1. Produce Bar
fig.add_trace(go.Bar(
y=y_indices, x=vals_produce, name='Цена на производител', orientation='h',
marker_color=COLOR_PRODUCE,
text=[f'{p:.2f} €' for p in vals_produce], textposition='inside',
customdata=customdata_all,
hovertemplate=common_hover,
offsetgroup='produce'
))
# 2. Distributor Margin Bar
fig.add_trace(go.Bar(
y=y_indices, x=distributor_vals, name='Надценка дистрибутор', orientation='h',
marker_color=COLOR_DISTRIBUTOR_MARGIN,
text=[f'{v:.2f} €' for v in distributor_vals], textposition='inside',
customdata=customdata_all,
hovertemplate=common_hover,
offsetgroup='distributor'
))
# 3. Distributor Margin Label Bar (Invisible)
fig.add_trace(go.Bar(
y=y_indices, x=distributor_vals, name='Дистрибутор %', orientation='h',
marker_color='rgba(0,0,0,0)',
text=[f'{p:+.1f}%' for p in distributor_pct], textposition='outside',
showlegend=False,
offsetgroup='distributor',
customdata=customdata_all,
hovertemplate=common_hover
))
# 4. Margin Bar
margin_color = [COLOR_MARGIN_POS if v >= 0 else COLOR_MARGIN_NEG for v in margin_vals]
fig.add_trace(go.Bar(
y=y_indices, x=margin_vals, name='Надценка търговец', orientation='h',
marker_color=margin_color,
text=[f'{v:.2f} €' for v in margin_vals], textposition='inside',
customdata=customdata_all,
hovertemplate=common_hover,
offsetgroup='margin'
))
# 5. Margin Label Bar (Invisible, for outside percentage label)
fig.add_trace(go.Bar(
y=y_indices, x=margin_vals, name='Марж %', orientation='h',
marker_color='rgba(0,0,0,0)',
text=[f'{p:+.1f}%' for p in margin_pct], textposition='outside',
showlegend=False,
offsetgroup='margin',
customdata=customdata_all,
hovertemplate=common_hover
))
# 4. Tax Bar
fig.add_trace(go.Bar(
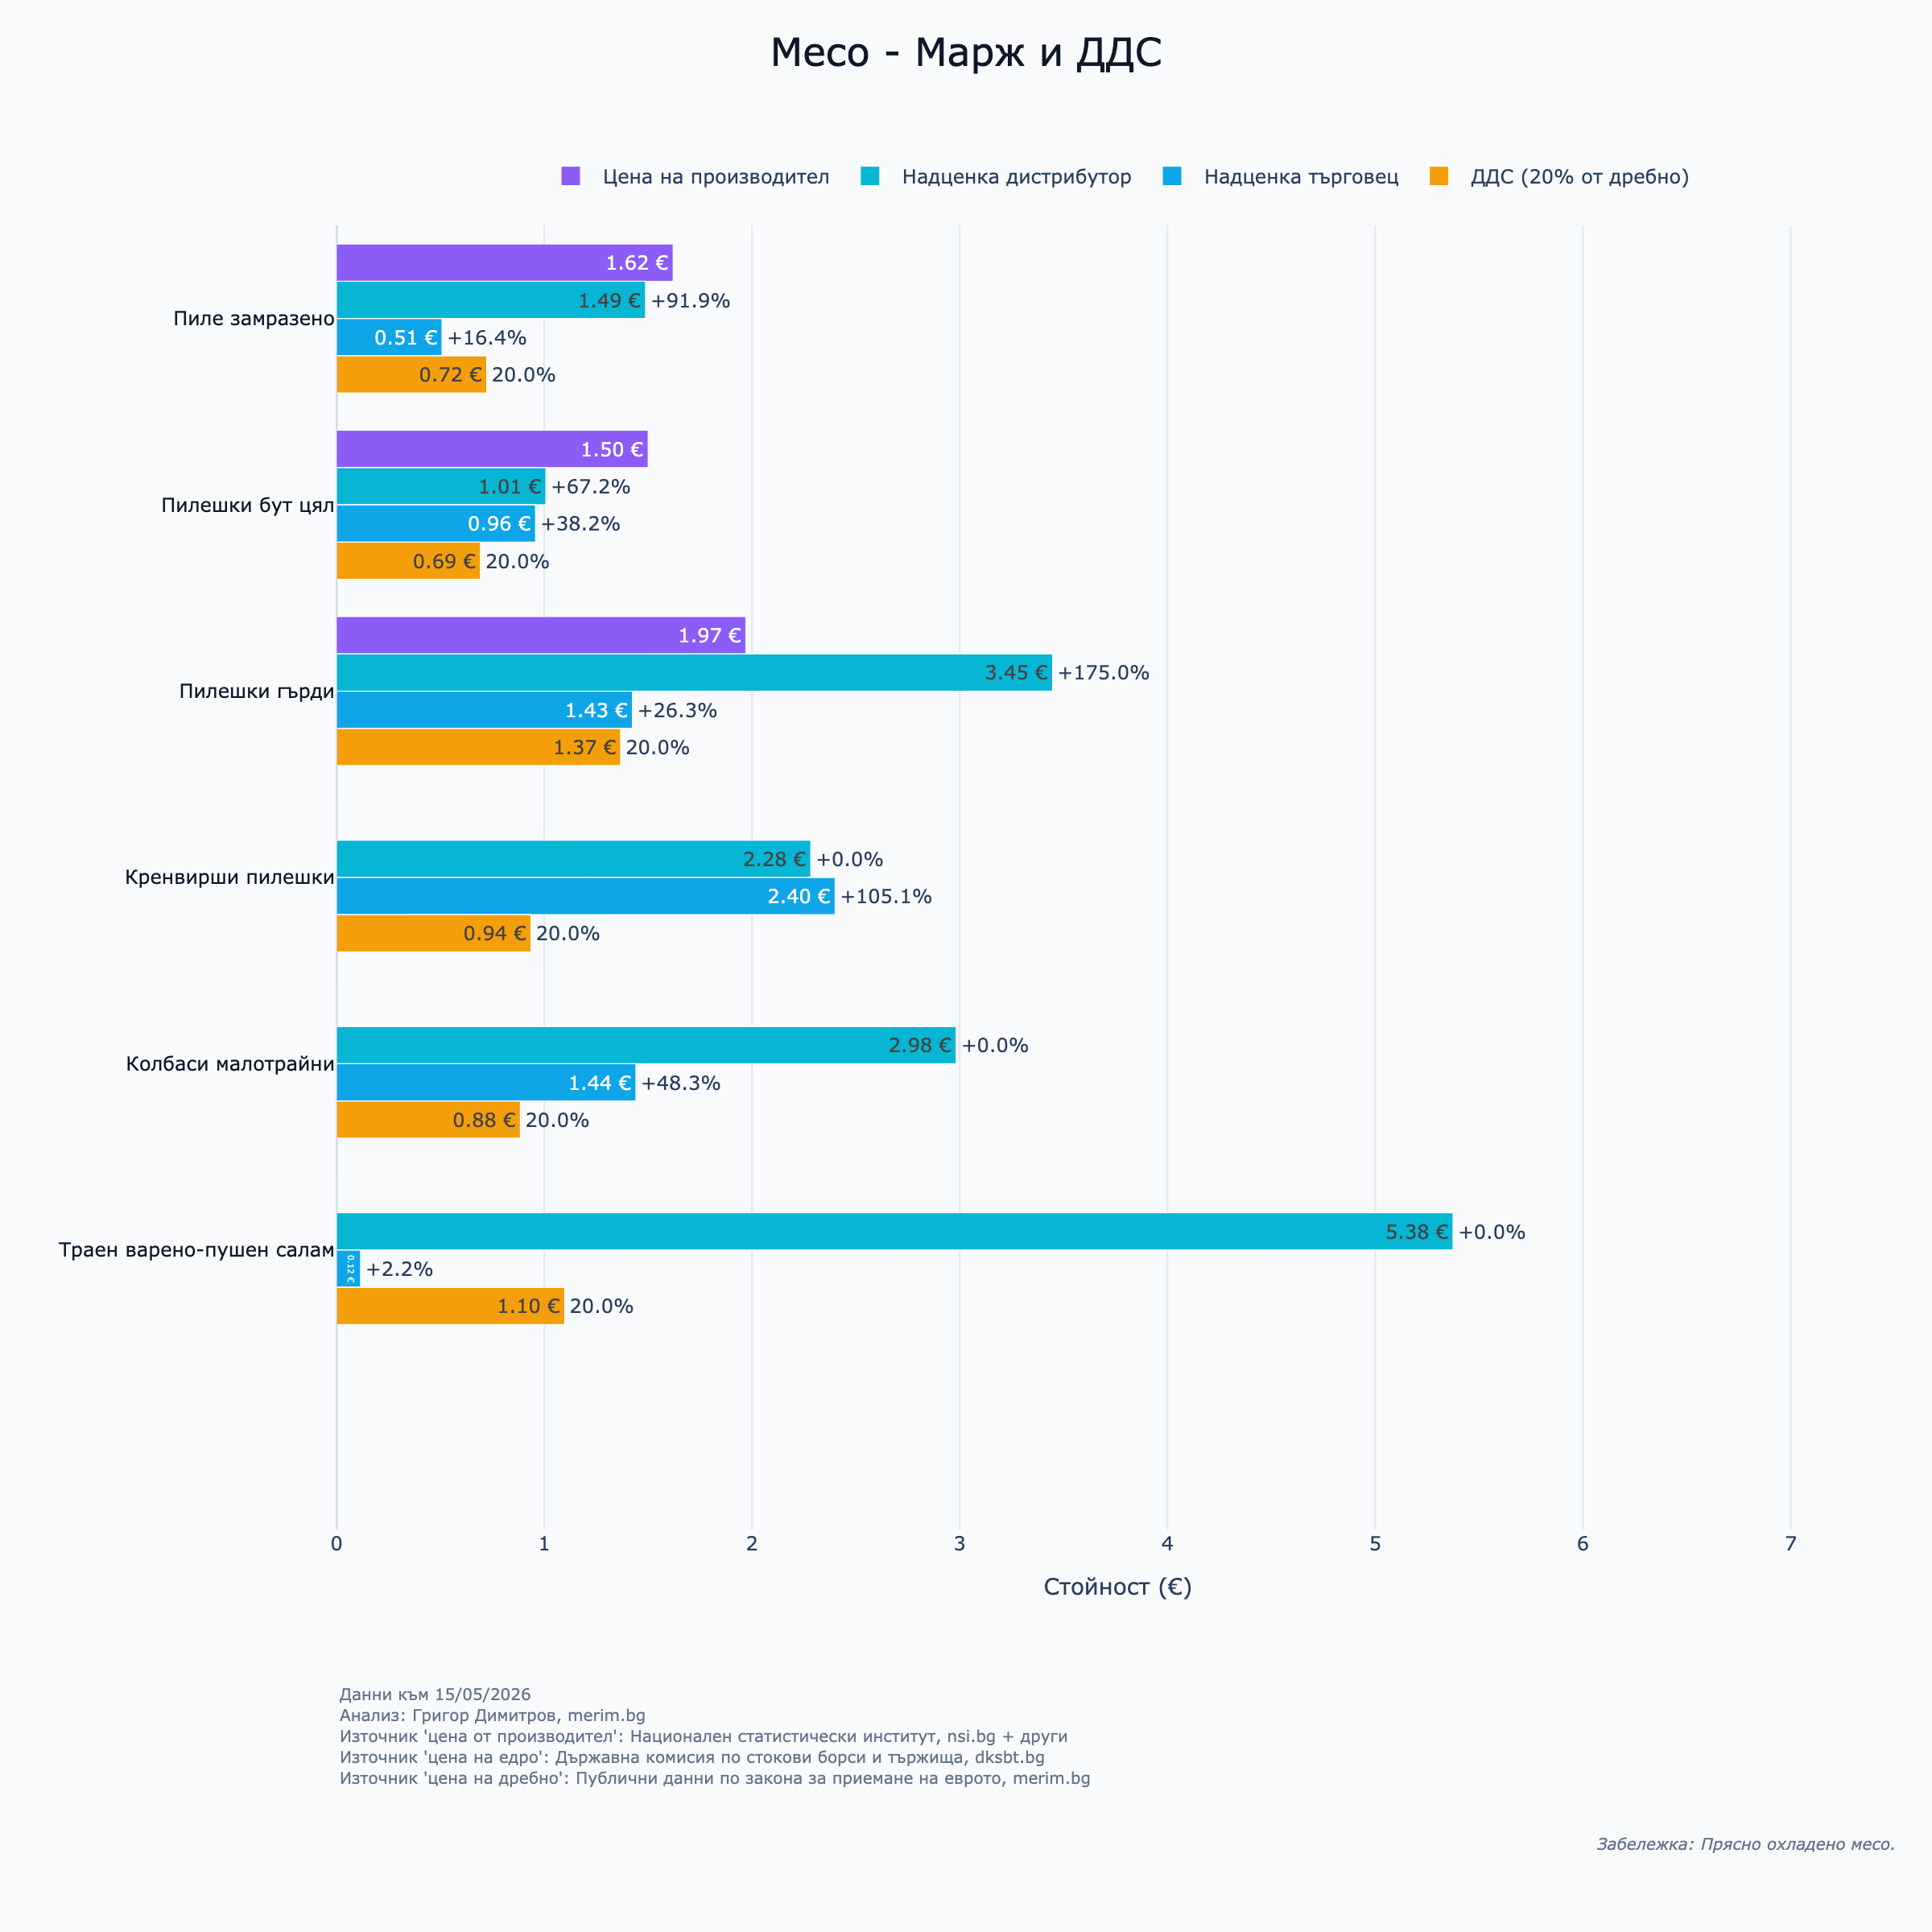
y=y_indices, x=tax_vals, name='ДДС (20% от дребно)', orientation='h',
marker_color=COLOR_TAX,
text=[f'{v:.2f} €' for v in tax_vals], textposition='inside',
customdata=customdata_all,
hovertemplate=common_hover,
offsetgroup='tax'
))
# 5. Tax Label Bar (Invisible, for outside percentage label)
fig.add_trace(go.Bar(
y=y_indices, x=tax_vals, name='ДДС %', orientation='h',
marker_color='rgba(0,0,0,0)',
text=['20.0%' for _ in tax_vals], textposition='outside',
showlegend=False,
offsetgroup='tax',
customdata=customdata_all,
hovertemplate=common_hover
))
fig.update_layout(
barmode='group',
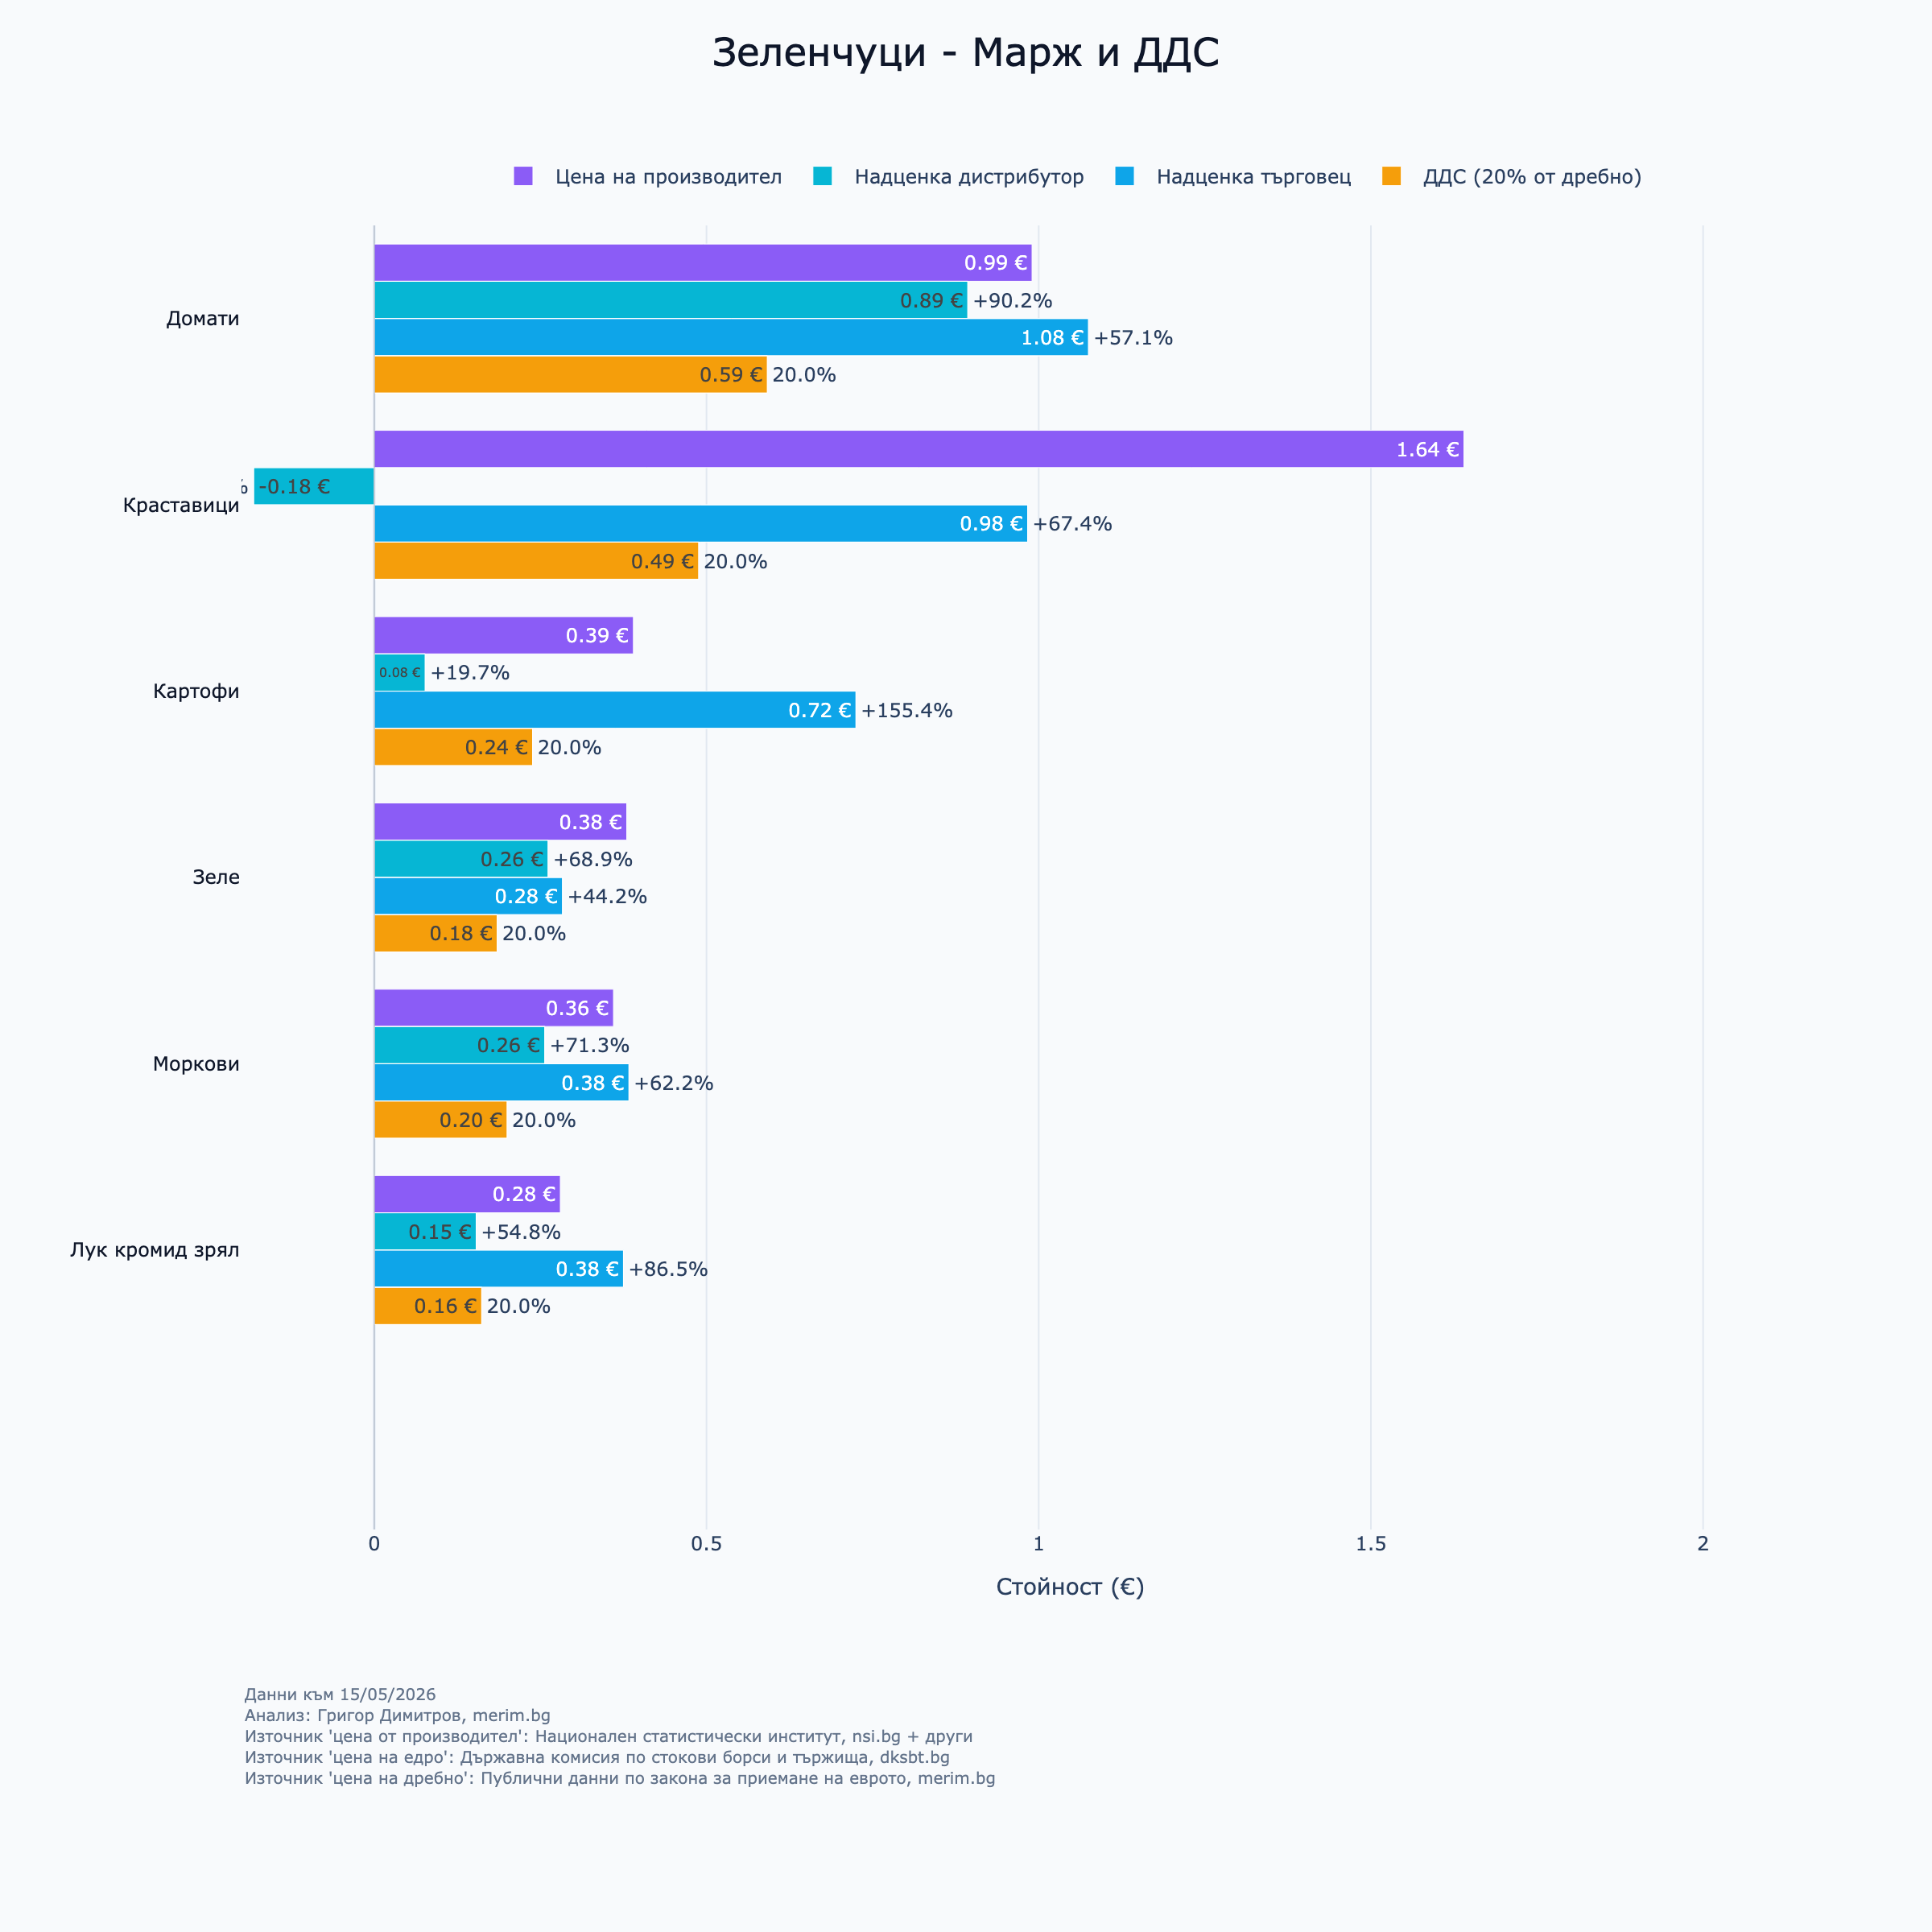
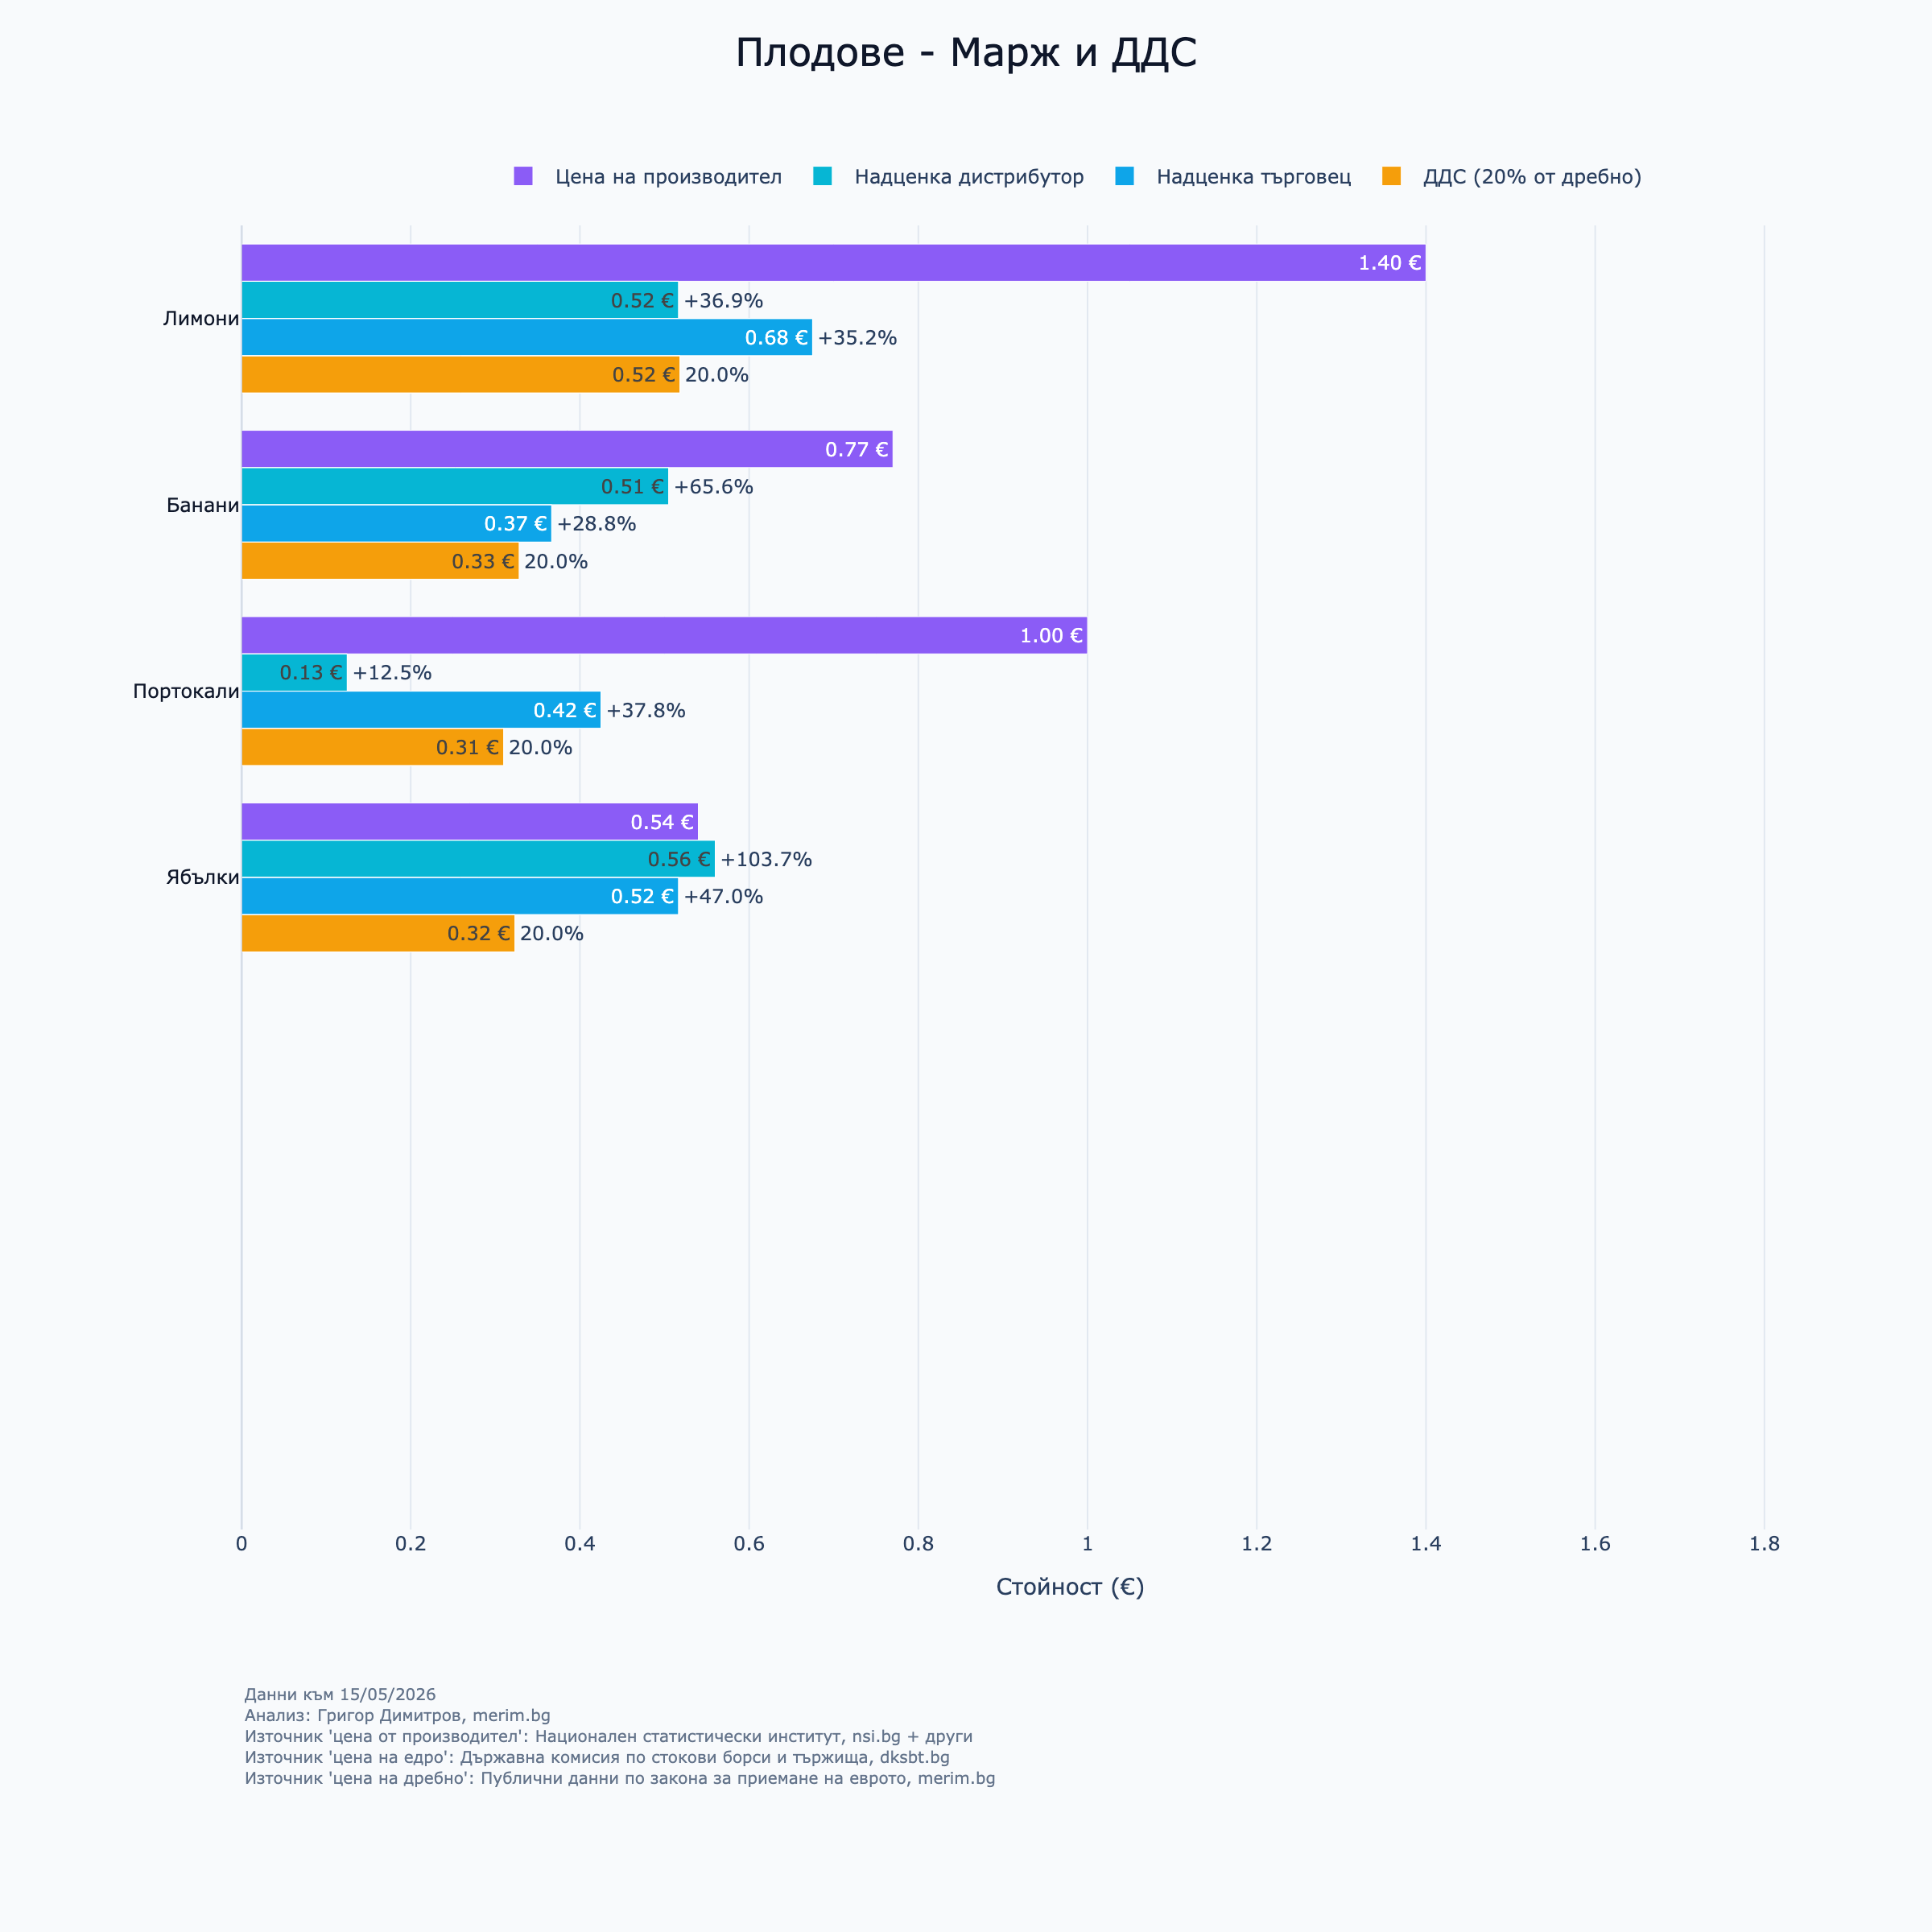
title=dict(text=f"{category_name} - Марж и ДДС", font=dict(size=24, color=TEXT_MAIN), x=0.5, y=0.98),
height=FIXED_HEIGHT,
template='plotly_white',
showlegend=True,
legend=dict(orientation='h', yanchor='bottom', y=1.02, xanchor='center', x=0.5),
margin=dict(l=150, r=20, t=140, b=250),
plot_bgcolor=BG_COLOR,
paper_bgcolor=BG_COLOR,
xaxis=dict(title='Стойност (€)', showgrid=True, gridcolor='#E2E8F0', range=[x_min, x_max]),
yaxis=dict(
title='', showgrid=False, tickfont=dict(color=TEXT_MAIN),
tickmode='array', tickvals=y_indices, ticktext=labels_short,
range=[MAX_ITEMS - 0.5, -0.5], autorange=False, fixedrange=True
)
)
# Reference Lines
fig.add_vline(x=0, line_width=1, line_color=TEXT_MUTED, opacity=0.3)
fig.add_annotation(
x=0, y=-0.2, xref='paper', yref='paper',
text=LEFT_FOOTNOTE, showarrow=False,
font=dict(size=10, color=TEXT_MUTED), align='left', xanchor='left', yanchor='bottom'
)
fig.add_annotation(
x=1, y=-0.25, xref='paper', yref='paper',
text=f"<i>{CATEGORY_NOTES.get(category_name, '')}</i>", showarrow=False,
font=dict(size=10, color=TEXT_MUTED), align='right', xanchor='right', yanchor='bottom'
)
fig.show()
return fig
all_figs = []
category_map = {
"Зеленчуци": "vegetables",
"Плодове": "fruits",
"Пакетирани": "packaged",
"Млечни и яйца": "dairy",
"Месо": "meat"
}
for category in df['type'].unique():
category_data = df[df['type'] == category]
fig = plot_interactive_price_chart(category_data, category)
all_figs.append(fig)
# Save PNG for gallery lightbox
safe_name = category_map.get(category, "other")
img_bytes = pio.to_image(fig, format='png', width=1200, height=1200, scale=2)
with open(f"plot_price_{safe_name}.png", "wb") as f_out:
f_out.write(img_bytes)
for category in df['type'].unique():
category_data = df[df['type'] == category]
fig = plot_interactive_normalized_margin_chart(category_data, category)
all_figs.append(fig)
# Save PNG for gallery lightbox
safe_name = category_map.get(category, "other")
img_bytes = pio.to_image(fig, format='png', width=1200, height=1200, scale=2)
with open(f"plot_margin_{safe_name}.png", "wb") as f_out:
f_out.write(img_bytes)